Lots of great discussion about myocarditis and how its defined In a recent preprint from authors (pictured below)
medrxiv.org/content/10.110…
medrxiv.org/content/10.110…

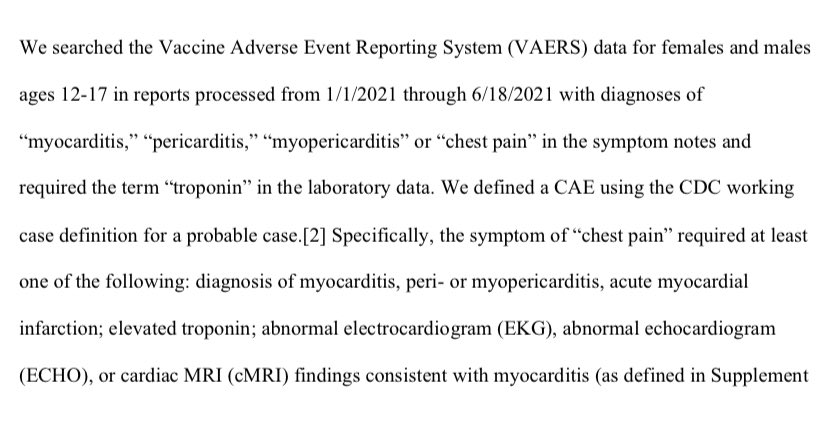
In this preprint , the VAERS database was interrogated for anyone given a diagnosis of myocarditis/pericarditis/myopericarditis/chest pain AND appears to require an abnormal very sensitive blood marker of cardiac damage (troponin)
A few bites about the VAERs database. It was legislated into existence via the National Childhood Vaccine Injury Act (NCVIA) in 1986, which was a mechanism to shield vax manufacturers from litigation related to potential adverse events after getting vaccinated
Sorting out cause after getting a vaccine is very hard. All because a 10,000 patient RCT doesn’t demonstrate a signal of harm doesn’t mean an important serious side effect seen at a rate of 1/50,000 doesn’t exist when the # of ppl to be vaccinated is tens of millions
Its a conundrum. You can’t force million person RCTs bc the cost wld be enormous, and it would take incredibly long to complete these trials. But you still want an ability to pick up rare side effects especially as most people being vaccinated r healthy
So VAERS came into being as a central record of adverse events after vaccine administration. But divining cause and effect this way is not easy. Every day ~2380 ppl die from cardiovascular disease. No doubt some will have recd. a vaccine in the days prior. heart.org/-/media/phd-fi…
Sorting out cause/effect is hard and requires medical experts combing through the details of the cases to figure out if the vaccine given may have been responsible.
A great example is the link found between the Astra Zeneca / JnJ vaccine and blood clots
cdc.gov/coronavirus/20…
A great example is the link found between the Astra Zeneca / JnJ vaccine and blood clots
cdc.gov/coronavirus/20…
The European Medical Agency first noted rare blood clots developing after the AZ vaccine
cdc.gov/coronavirus/20…
cdc.gov/coronavirus/20…

It was VAERS that picked up rare cases after the similarly constructed JnJ vaccine (the AZ vaccine was never approved for use in the US)
Important: not enough here to just find +ve cases after vaccine administration ..
Important: not enough here to just find +ve cases after vaccine administration ..

The peculiarity here was completely healthy ppl developing a rare type of blood clot in association with a low platelet count in proximity to the vaccine.
nejm.org/doi/full/10.10…
nejm.org/doi/full/10.10…

The end result practically has been a recommendation against the AZ/JnJ vaxx in younger women if a safer alternative vaxx is available.
It was also VAERS that resulted in finding a rare problem with a rotavirus vaccine cdc.gov/vaccines/vpd-v…
It was also VAERS that resulted in finding a rare problem with a rotavirus vaccine cdc.gov/vaccines/vpd-v…
But establishing cause required investigation well beyond reports on VAERS. So any report in isolation about VAERS reports isn’t causal and needs context. (A limitation — all studies have them!)
But the ? As it relates to myocarditis diagnoses makes one wonder about how the CDC went about trying to assess COVID - myocarditis risk .. Here is a CDC paper that leads to an estimate of myocarditis in 1/754 COVID pts <16 cdc.gov/mmwr/volumes/7…
But how did they diagnose myocarditis ?
“those who had their first of at least one inpatient encounter, at least two outpatient encounters, or at least one outpatient encounter with a relevant specialist** with a myocarditis ICD-10-CM code during March 2020– February 2021.”
“those who had their first of at least one inpatient encounter, at least two outpatient encounters, or at least one outpatient encounter with a relevant specialist** with a myocarditis ICD-10-CM code during March 2020– February 2021.”
Lots of limitations :
Risk estimates reflect risk for myocarditis among persons who received a diagnosis of COVID-19 in an encounter w/ the health system.
That mild cold the 5 year old had that u didn’t call anyone about? Not included.
Risk estimates reflect risk for myocarditis among persons who received a diagnosis of COVID-19 in an encounter w/ the health system.
That mild cold the 5 year old had that u didn’t call anyone about? Not included.
Every COVID seroprevalence study done suggests a wide gap between COVID cases diagnosed by an interaction with the health system.. This CDC study estimates a ~10% prevalence with a wide range based on ethnicity cdc.gov/mmwr/volumes/7…

In this table used to generate the 1:754 rate of covid myocarditis by some in the <16 age group , if u assume a ~10% prevalence of COVID , that would balloon the total with COVID # to ~370,000

The numerator would change 2 of course, but the 1:754 (86:64,898) estimate as it relates to risk of covid myocarditis wld seem to be a pretty sig. overestimate.
Interestingly, 1 way of checking these CDC #s wld be to see if the without COVID myocarditis rates are close to the prior baseline prevalence of myocarditis (132:3670762). They aren’t..the rate here ~4/100k, is much higher than the xpected 0.25-2:100k/yr
researchgate.net/publication/32…
researchgate.net/publication/32…
Other big limitation: myocarditis was determined by ICD10 code only and was not confirmed by clinical data (laboratory tests or cardiac imaging)
Remember the most recent preprint by the 4 horsemen : 211/256 had a +ve Troponin.
Remember the most recent preprint by the 4 horsemen : 211/256 had a +ve Troponin.
3rd big limitation: myocarditis has many causes other than COVID… no chart review took place to exclude alternative possibilities
Lastly, sick inpatients/outpatients are understandably investigated/ probed with diagnostic tests (like troponins and imaging) at much higher rates than those not encountering the health system
So the rate of pulmonary nodules in patients diagnosed with a pneumonia are sure to be much higher than a control population not encountering the health system. This does not mean pneumonias cause pulmonary nodules
So troponin elevations in a cohort of sick inpatients has a very different meaning than troponin elevations in a cohort of healthy young kids presenting to the ER with chest pain.
I find the recent preprint and the CDC study informative and helpful. Neither are perfect.
I do find it odd that one set of authors r tarred and feathered for methodological limitations while there’s relatively little fuss about the other
I do find it odd that one set of authors r tarred and feathered for methodological limitations while there’s relatively little fuss about the other
Beyond that, some present the numbers from one CDC study as ‘fact’, and the thrust of the article this is excerpted from strongly seems to suggest those physicians who don’t present these numbers are anti-vax. Very odd.

Those sloppy with linking COVID as causing myocarditis don’t seem well positioned to complain about the normal methodological limitations that plague every paper seeking to link 2 events together.
• • •
Missing some Tweet in this thread? You can try to
force a refresh