A bit late to the party with comment on the PHE data issued on Thu, and the issue with NIMS/ONS population figures has been well described by many, including @JamesWard73.

But worth setting out how it affects my previous estimate of effectiveness, shown again here.

1/
That used ONS data for the 50+ population, 21.3m, and deducting those we know to be vaccinated, came up with 0.77m without any jabs. Move to a NIMS figure, 22.4m, and the number unjabbed increases by the full difference, to 1.83m - ie it more than doubles.

2/
If you more than double the denominator, the resulting rate for the unvaxxed more than halves, and you see the difference here. Note the other figures are unchanged, as we know those populations.

3/
Which estimate of population to use has been hotly debated, and this issue shows the risks of using data without understanding its limitations.

But which one is right you ask? As a sense check, using NIMS data gives an efficacy for admissions of 78%, whereas ONS gives 91%.
4/
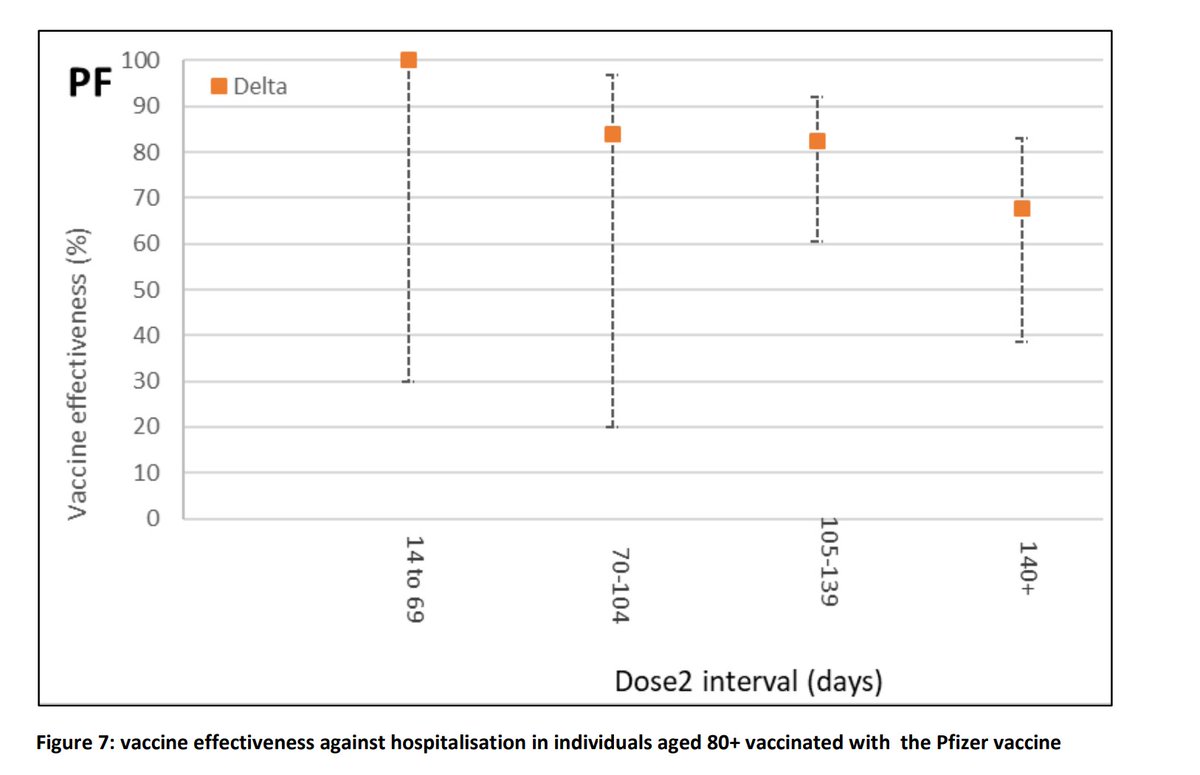
Elsewhere in the same report from PHE, efficacy against hospitalisation from Delta is put at 96%, which might suggest the ONS data is closer to the mark.

5/
It's great we now have a much more detailed age split, but the confusion over data, (disappointingly amplified by @Peston who should have done more research given his influence), has, at best, diluted the impact.

6/
And even figures based on the NIMS data still provide a compelling reason to be vaccinated if you are one of the older age groups who are still unpersuaded as to the benefits.

7/
And looking at younger age groups, whilst death is much rarer, the equivalent data for admissions shows that vaccination still results in a very significant reduction in your risk of being hospitalised.

8/
There were 438 admissions for under 18s in the four week period in the data. Unfortunately the majority of these will not have had the opportunity to be vaccinated (a different subject), but this highlights the ongoing risk to younger people.

9/
Thanks to all those at PHE involved in this latest enhancement to the data. I know it's been long asked for, but I don't underestimate the work involved in getting the data, crunching the numbers and setting up a process for weekly updates.

10/10

assets.publishing.service.gov.uk/government/upl…

• • •

Missing some Tweet in this thread? You can try to force a refresh
 

Keep Current with John Roberts

John Roberts Profile picture

Stay in touch and get notified when new unrolls are available from this author!

Read all threads

This Thread may be Removed Anytime!

PDF

Twitter may remove this content at anytime! Save it as PDF for later use!

Try unrolling a thread yourself!

how to unroll video
  1. Follow @ThreadReaderApp to mention us!

  2. From a Twitter thread mention us with a keyword "unroll"
@threadreaderapp unroll

Practice here first or read more on our help page!

More from @john_actuary

14 Sep
The PHE paper presented to SAGE on vaccine efficacy waning is also published today. A quick run down of the paper, focussing on experience with Delta (orange dots).

For hospitalisation, the drop-off appears greater with AZ, though note the wide band of the latest point.

1/
Here we can see that there's a much more pronounced drop-off in the 65+ group. The AZ falls after 4 1/2months are of such an extent that I wonder what the rationale is for waiting 6 months for the booster dose?

2/
Note that whilst Pfizer looks much better in the 65+ analysis, once that is restricted to 80+, the drop off becomes more apparent with this vaccine too. Some of this may be because a proportion of this group had the 2nd dose after just 3 weeks.

3/
Read 7 tweets
14 Sep
The latest SPI-M modelling summary includes possible scenarios for England admiss'ns over the coming months.

The green line, assuming R=1.1 suggests a peak figure approaching 2,000 per day during Oct. Comment is that the green and blue lines contain the "likely" trajectory.
1/
The red scenario (R=2.0) is considered extreme, to the extent that the graph doesn't show the peak that would result.

The extent of continued homeworking is considered a key factor in how quickly admissions might rise.

2/
The paper notes that current occupancy (c6,200) is only around 2 1/2 doublings from the peak in Jan, and discusses whether re-imposition of some "light" measures may be necessary to suppress any growth.

3/
Read 4 tweets
14 Sep
Latest Care Home deaths (as notified to CQC) show a further increase this week, after a dip last week that may have been due to BH delays.

The average of the last two weeks though suggests the trend may now possibly be more level at c100 pw.

1/
For 70+ more generally there's a further increase too, in a week where both overall and COVID deaths are down due to the BH week (these figures are a week behind CH data). That's less encouraging.

2/
As usual, a reminder that we don't have a split for either group on "with" or "from" COVID, nor of vaccination status.

However, for all COVID related deaths, the proportion of "from" COVID cases is 88% this week.

3/
Read 5 tweets
13 Sep
The ONS has added to recent analyses of relative mortality by vaccination status with a new release today, using age-standardised mortality rates (ASMR).

TLDR: COVID death rates for fully vaccinated people are much much lower.

1/
Note the report does include number counts, but clearly states that the priority ordering of the roll-out makes these comparisons of limited use. Also many of the deaths were at a time when vacc'n coverage was very limited.

Hence the focus on weekly age-standardised rates.
2/
Looking at the underlying data, we see that in the last four weeks of the analysis, ASMRs for COVID deaths have been 10x higher for the unvaccinated.

Note also the increases approaching the early July peak.

3/
Read 7 tweets
10 Sep
Not on @COVID19actuary Friday Report duty today, so here’s a few photos of today’s walk of the Pembrokeshire coastal path instead, starting with some seals swimming near Fishguard.

1/ Image
We passed a lot of cows, but these were particularly photogenic.

2/ Image
Inspired by last night’s Twitter game, my afternoon sustenance had to be Welsh cakes, washed down with a local brew of course.

3/ Image
Read 5 tweets
2 Sep
ONS data released today shows that there was no evidence of an increase in suicides during the first four months of lockdown. Indeed, there was a statistically significant reduction in suicides, 12.7% lower than the 5 year average, predominately due to a reduction for males.

1/
The biggest % falls were for younger age groups, with 22% (against the 5 yr average) for 10-24, and 15% for 25 -44. All age groups reported falls though, and the lowest rates observed over the 6 year period shown.

2/
ONS notes that much of this reduction occurred in April, with a statistically significant fall in that month compared with Apr 19. There were lesser falls in the subsequent months, but they were not statistically significant.

3/
Read 7 tweets

Did Thread Reader help you today?

Support us! We are indie developers!


This site is made by just two indie developers on a laptop doing marketing, support and development! Read more about the story.

Become a Premium Member ($3/month or $30/year) and get exclusive features!

Become Premium

Too expensive? Make a small donation by buying us coffee ($5) or help with server cost ($10)

Donate via Paypal Become our Patreon

Thank you for your support!

Follow Us on Twitter!

:(