Why do VIX Futures trade at different prices to VIX?
Derivatives can be complicated, but the answer to this question is not.
If you understand how the market prices risk then you'll know a lot without needing to know a lot.
Let's walk through it. 🧵👇
1/n
Derivatives can be complicated, but the answer to this question is not.
If you understand how the market prices risk then you'll know a lot without needing to know a lot.
Let's walk through it. 🧵👇
1/n
Pull up a chart of the VIX index.
tradingview.com/chart/D5QuNI5X…
If you're an experienced trader, you'll recognize immediately that this is not a thing you can trade.
Why?
Cos it wouldn't look like that if people could trade it.
2/n
tradingview.com/chart/D5QuNI5X…
If you're an experienced trader, you'll recognize immediately that this is not a thing you can trade.
Why?
Cos it wouldn't look like that if people could trade it.
2/n
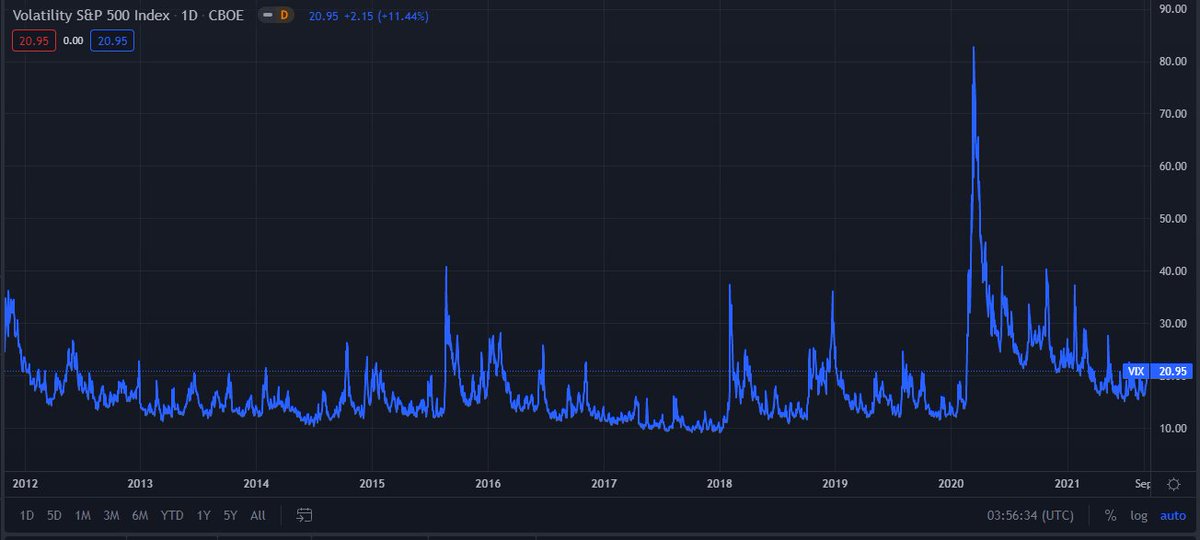
Cos, just by eyeballing the time series chart, you can tell VIX is very predictable:
- It stays about the same in the short term
- But if it's low it's more likely to go up
- And if it's high it's more likely to go down
- It has a floor under which it's unlikely to go lower
3/n
- It stays about the same in the short term
- But if it's low it's more likely to go up
- And if it's high it's more likely to go down
- It has a floor under which it's unlikely to go lower
3/n

So trading it would be really easy.
You'd buy it when it was very low
You'd sell when it was higher
Trading real instruments ain't that easy.
If everyone who can look at a chart thinks it's gonna go up, there will nobody to sell it cheap.
4/n
You'd buy it when it was very low
You'd sell when it was higher
Trading real instruments ain't that easy.
If everyone who can look at a chart thinks it's gonna go up, there will nobody to sell it cheap.
4/n

So we come to Important Point 1: *VIX is a calculation. It's not a real thing you can trade*
That's why the chart looks like that
We'll discuss what VIX actually is in a sec.
But let's keep pretending we can trade it cos I have another important point to make.
5/n
That's why the chart looks like that
We'll discuss what VIX actually is in a sec.
But let's keep pretending we can trade it cos I have another important point to make.
5/n

Look at the VIX chart again and pretend you can trade it.
Which trade would be easier?
Long when it's low?
Short when it's high?
The long is easier, right?
VIX essentially never goes below 9 - but it can spike to very large values.
6/n
Which trade would be easier?
Long when it's low?
Short when it's high?
The long is easier, right?
VIX essentially never goes below 9 - but it can spike to very large values.
6/n

So you, as imaginary trader of untradeable indices, would rather long VIX when it's low than short VIX when it's high.
And you'd be happier sizing the long bigger.
Cos you're relatively confident that VIX isn't going to go much lower than 9.
7/n
And you'd be happier sizing the long bigger.
Cos you're relatively confident that VIX isn't going to go much lower than 9.
7/n
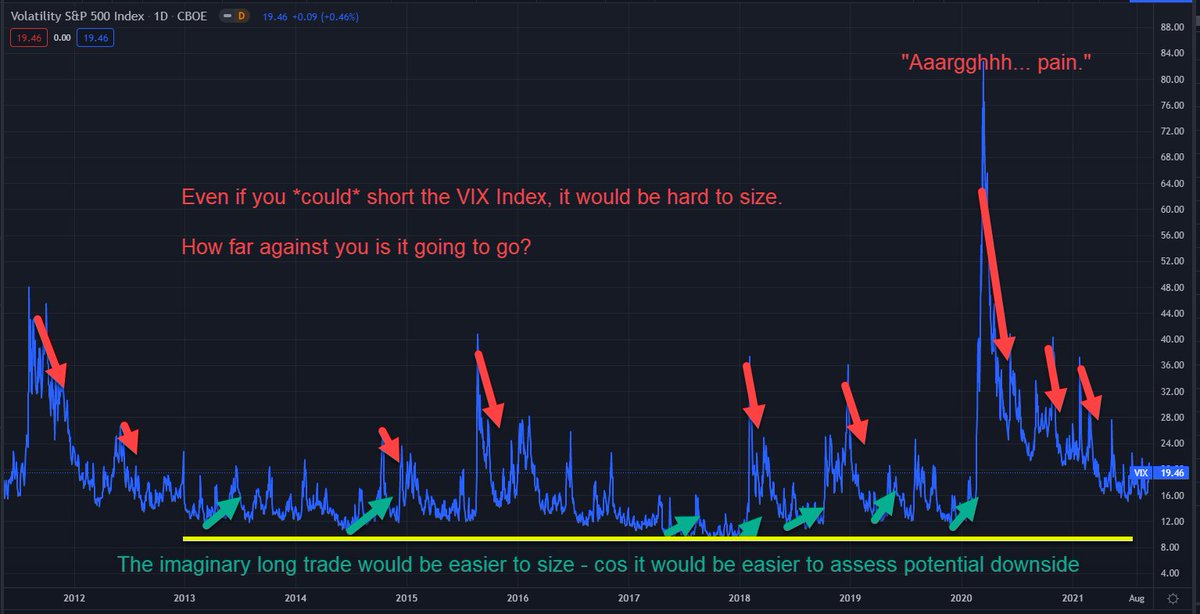
But who knows how high VIX could go on a spike?
If you were shorting VIX that could cause you a lot of pain for you and your broker.
Important Point 2: If you could trade VIX you'd rather buy it than sell it.
(What might this imply about the price of tradable VIX bets?)
8/n
If you were shorting VIX that could cause you a lot of pain for you and your broker.
Important Point 2: If you could trade VIX you'd rather buy it than sell it.
(What might this imply about the price of tradable VIX bets?)
8/n

Probably time to explain what VIX actually is, eh?
We're gonna hand-wave this a bit, cos it's not actually that crucial to the main question here.
And we don't wanna get lost in the weeds.
But we're traders, not neanderthals. So - here comes the science bit...
9/n
We're gonna hand-wave this a bit, cos it's not actually that crucial to the main question here.
And we don't wanna get lost in the weeds.
But we're traders, not neanderthals. So - here comes the science bit...
9/n

VIX is an index calculation from the CBOE designed to estimate the option market's expectation of the "volatility" of SPX over the next 30 days
[Quotes around volatility a vain attempt to avoid a @bennpeifert yellow card whilst keeping it simple]
How do they calculate it?
10/n
[Quotes around volatility a vain attempt to avoid a @bennpeifert yellow card whilst keeping it simple]
How do they calculate it?
10/n

They get all SPX option contracts, expiring in 30 days.
(Assume they exist.)
Then they ask "what would the variance of SPX returns need to be over the next 30 days to justify these prices (if we expect that SPX only goes up, on average, by the risk-free rate?)"
11/n
(Assume they exist.)
Then they ask "what would the variance of SPX returns need to be over the next 30 days to justify these prices (if we expect that SPX only goes up, on average, by the risk-free rate?)"
11/n

Then they take the square root of that to get a number that looks like volatility.
[Nerd Aside: Technically VIX estimates return *variance* expectations, scaled to look like volatility. This is one reason it is biased higher than SPX vol, as we'll touch on later.]
12/n
[Nerd Aside: Technically VIX estimates return *variance* expectations, scaled to look like volatility. This is one reason it is biased higher than SPX vol, as we'll touch on later.]
12/n
Now, a lot was glossed over there.
But we don't need to have much more than a good insight into risk preferences to understand why tradeable VIX derivatives trade at different prices to the VIX index.
So let's introduce ourselves to VIX Futures.
13/n
But we don't need to have much more than a good insight into risk preferences to understand why tradeable VIX derivatives trade at different prices to the VIX index.
So let's introduce ourselves to VIX Futures.
13/n
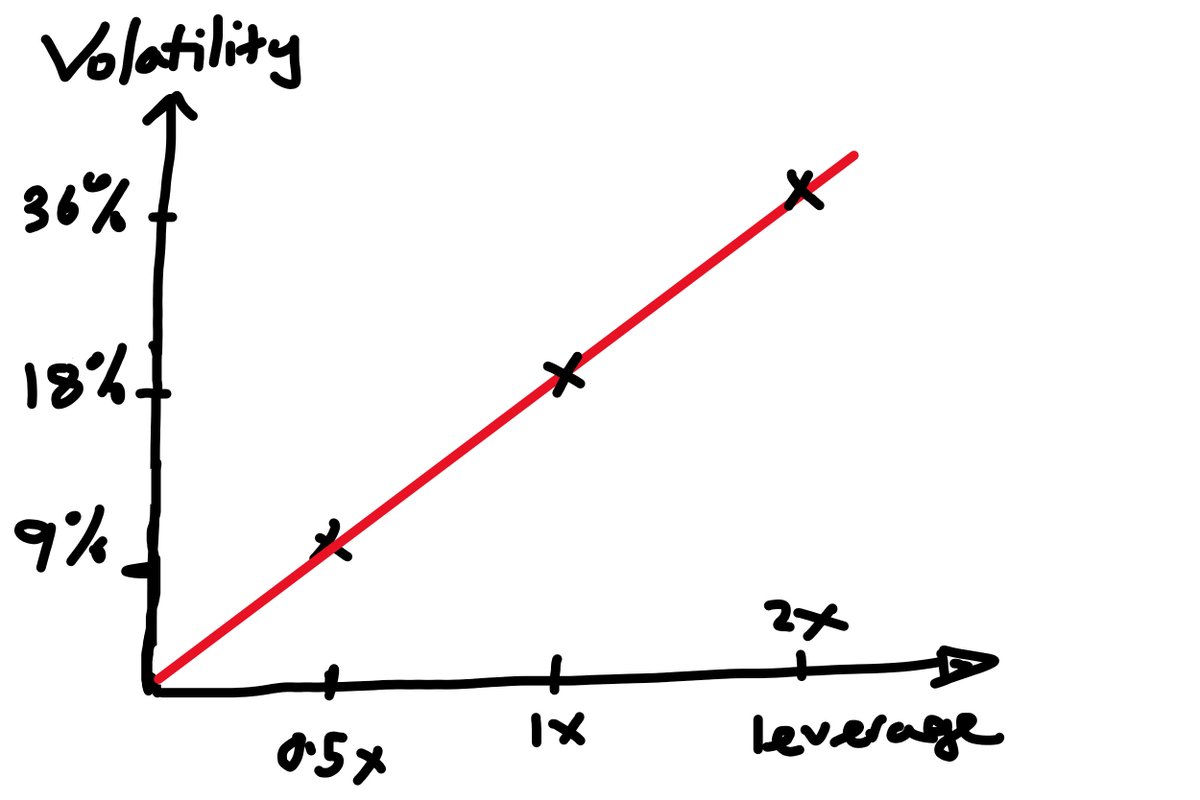
A VIX Futures Contract is basically a bet on the future value of the VIX Index.
Consider the VIX Futures Contract that expires on 19th October 2021.
At expiry, that contract will be worth $1,000 x the VIX index.
(The $1,000 is called the contract size - it's arbitrary.)
14/n
Consider the VIX Futures Contract that expires on 19th October 2021.
At expiry, that contract will be worth $1,000 x the VIX index.
(The $1,000 is called the contract size - it's arbitrary.)
14/n

The VIX future contract is quoted in VIX terms.
So, if you long the October VIX future at 20, the nominal value of your position is 20 x $1k = $20k
On 19th October expiry, if the VIX index is at 21 - then the nominal value of your position is $21k
You made $1k
15/n
So, if you long the October VIX future at 20, the nominal value of your position is 20 x $1k = $20k
On 19th October expiry, if the VIX index is at 21 - then the nominal value of your position is $21k
You made $1k
15/n

Stay with me...
But I thought that detail was important to cover.
From now on we're just going to talk about prices in VIX terms.
The Important Thing is This...
16/n
But I thought that detail was important to cover.
From now on we're just going to talk about prices in VIX terms.
The Important Thing is This...
16/n

We know the price of the VIX future will converge with the value of the VIX index at expiry.
And we know we can't trade VIX, so there's no arb trade between index and futures.
So there's no invisible force tethering the VIX futures to the *current* VIX Index value.
17/n
And we know we can't trade VIX, so there's no arb trade between index and futures.
So there's no invisible force tethering the VIX futures to the *current* VIX Index value.
17/n

So VIX futures are really just bets on the *future* value of VIX.
And what do we recall about VIX from earlier?
1. It's predictable
2. If we *could* trade it, we'd rather be long than short.
So we would expect these 2 things to be represented in the VIX futures price.
18/n
And what do we recall about VIX from earlier?
1. It's predictable
2. If we *could* trade it, we'd rather be long than short.
So we would expect these 2 things to be represented in the VIX futures price.
18/n
Let's go back in time to illustrate this.
It's 3rd Jan 2018. VIX closes at 9.2 - the lowest close ever.
The Jan VIX futures expire in 15 days, what price do they trade at?
Consider that, for them to trade, a buyer and seller must both be happy to trade at that price.
19/n
It's 3rd Jan 2018. VIX closes at 9.2 - the lowest close ever.
The Jan VIX futures expire in 15 days, what price do they trade at?
Consider that, for them to trade, a buyer and seller must both be happy to trade at that price.
19/n
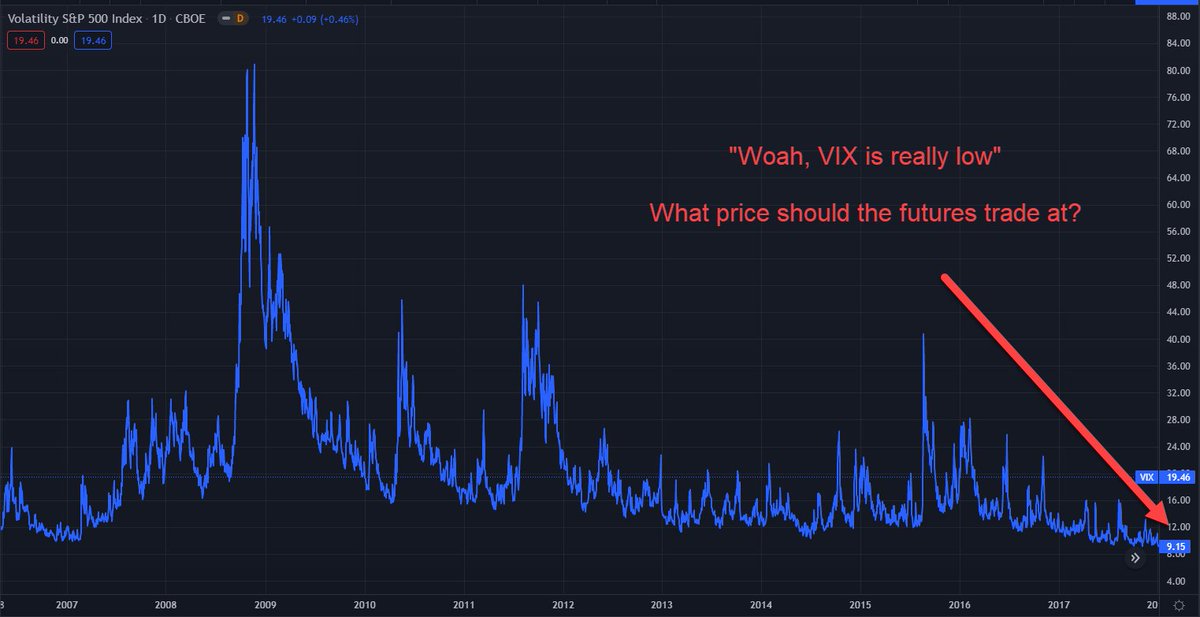
Would you be happy to BUY Jan VIX Futures at 9.2?
HELL YEAH!
VIX is more likely to go higher, not lower.
And it's unlikely to go much lower, but it could go a LOT higher!
Long at 9.2 would be a nice +ve expectation bet with limited downside and huge potential upside.
20/n
HELL YEAH!
VIX is more likely to go higher, not lower.
And it's unlikely to go much lower, but it could go a LOT higher!
Long at 9.2 would be a nice +ve expectation bet with limited downside and huge potential upside.
20/n

Would you be happy to SELL Jan VIX Futures at 9.2?
HELL NO!
VIX is more likely to go higher, not lower.
And it's unlikely to go much lower, but it could go a LOT higher!
Shorting at 9.2 would be a -ve expectation bet with huge potential downside and v limited upside.
21/n
HELL NO!
VIX is more likely to go higher, not lower.
And it's unlikely to go much lower, but it could go a LOT higher!
Shorting at 9.2 would be a -ve expectation bet with huge potential downside and v limited upside.
21/n

For VIX Futures to trade, we need a price that both buyers and sellers are happy with.
Buying at 9.2 is very attractive
Selling at 9.2 is very unattractive
So, unhappy sellers demand a premium - they want a higher price.
And happy buyers are willing to pay it.
22/n
Buying at 9.2 is very attractive
Selling at 9.2 is very unattractive
So, unhappy sellers demand a premium - they want a higher price.
And happy buyers are willing to pay it.
22/n
So we'd expect the Jan VIX Futures to be trading higher than 9.2
Go to vixcentral.com and click "Historical Prices" and go back to 3rd Jan '18.
The Jan futures contract, expiring in 15 days, is priced at 10.7 - which is 1.5 points higher than the VIX Index.
23/n
Go to vixcentral.com and click "Historical Prices" and go back to 3rd Jan '18.
The Jan futures contract, expiring in 15 days, is priced at 10.7 - which is 1.5 points higher than the VIX Index.
23/n

Sellers were only prepared to sell at a premium cos the bet was so unattractive.
Buyers were prepared to meet them there cos the bet was so attractive.
Everyone knows VIX is more likely to go up from a super low print. Everyone prefers high upside/low downside bets.
24/n
Buyers were prepared to meet them there cos the bet was so attractive.
Everyone knows VIX is more likely to go up from a super low print. Everyone prefers high upside/low downside bets.
24/n
The difference between the futures price and the index is called the "basis".
It consists mostly of two components:
1. Rational market expectation of predictable future changes in VIX
2. A premium sellers demand for taking on exposures with low upside & high downside.
25/25
It consists mostly of two components:
1. Rational market expectation of predictable future changes in VIX
2. A premium sellers demand for taking on exposures with low upside & high downside.
25/25

• • •
Missing some Tweet in this thread? You can try to
force a refresh