1. This thread presents concerns regarding Fig 1B-E of Holmes et al 2021
cell.com/cell/fulltext/…
@Ayjchan @gdemaneuf @TheSeeker268 @JeremyFarrar @stuartjdneil @lab_leak
Note: I am a retired geologist with decades of experience in the making and interpretation of maps.
cell.com/cell/fulltext/…
@Ayjchan @gdemaneuf @TheSeeker268 @JeremyFarrar @stuartjdneil @lab_leak
Note: I am a retired geologist with decades of experience in the making and interpretation of maps.
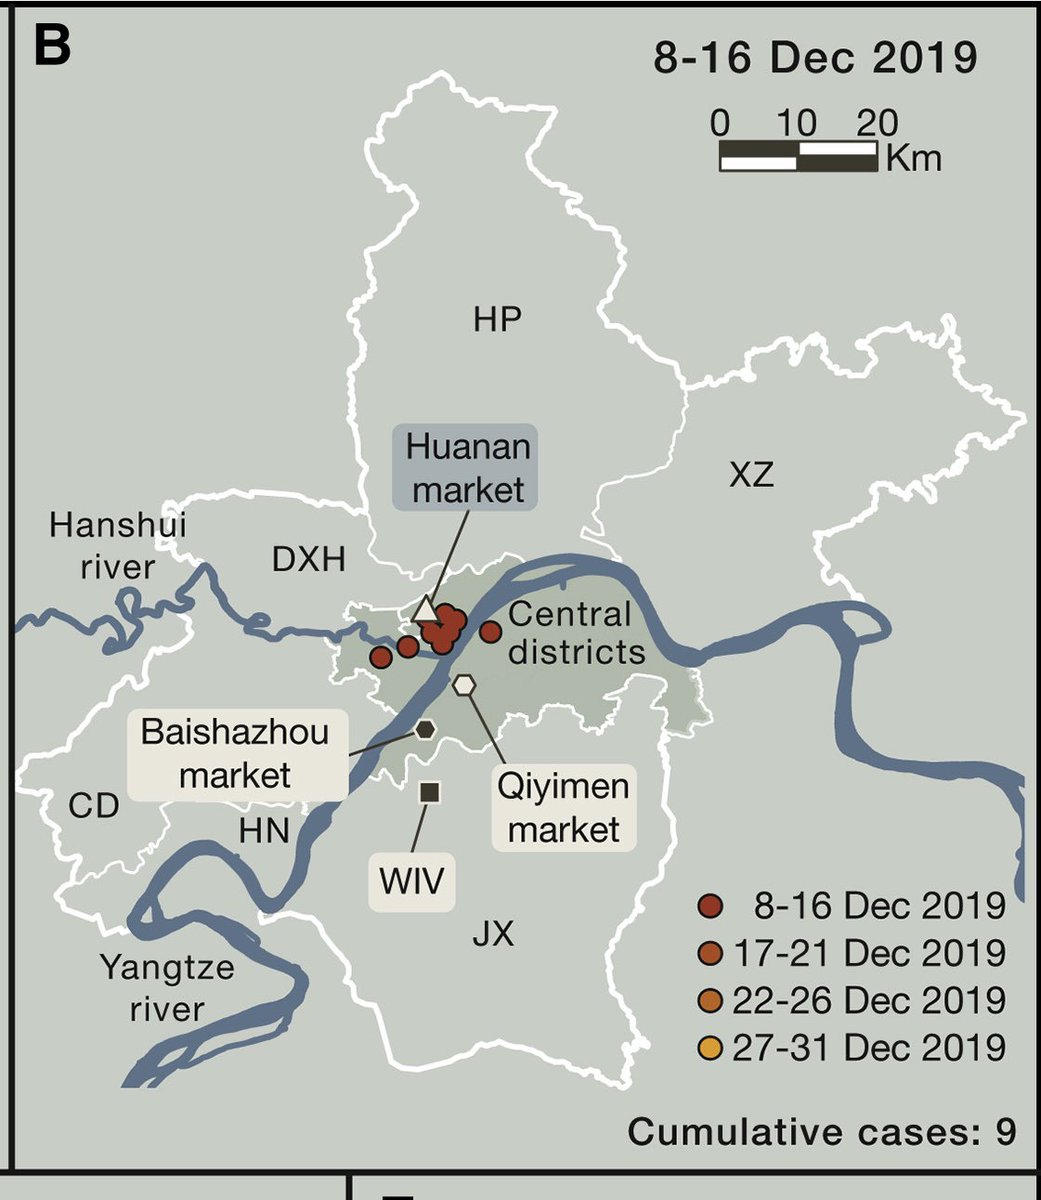
2.Fig 1 and caption for B-E shown below.
In keeping with the style of graphics in science journals, the maps are tiny, which hampers their ability to provide detail.

In keeping with the style of graphics in science journals, the maps are tiny, which hampers their ability to provide detail.


3. The locations of the dots were obtained from
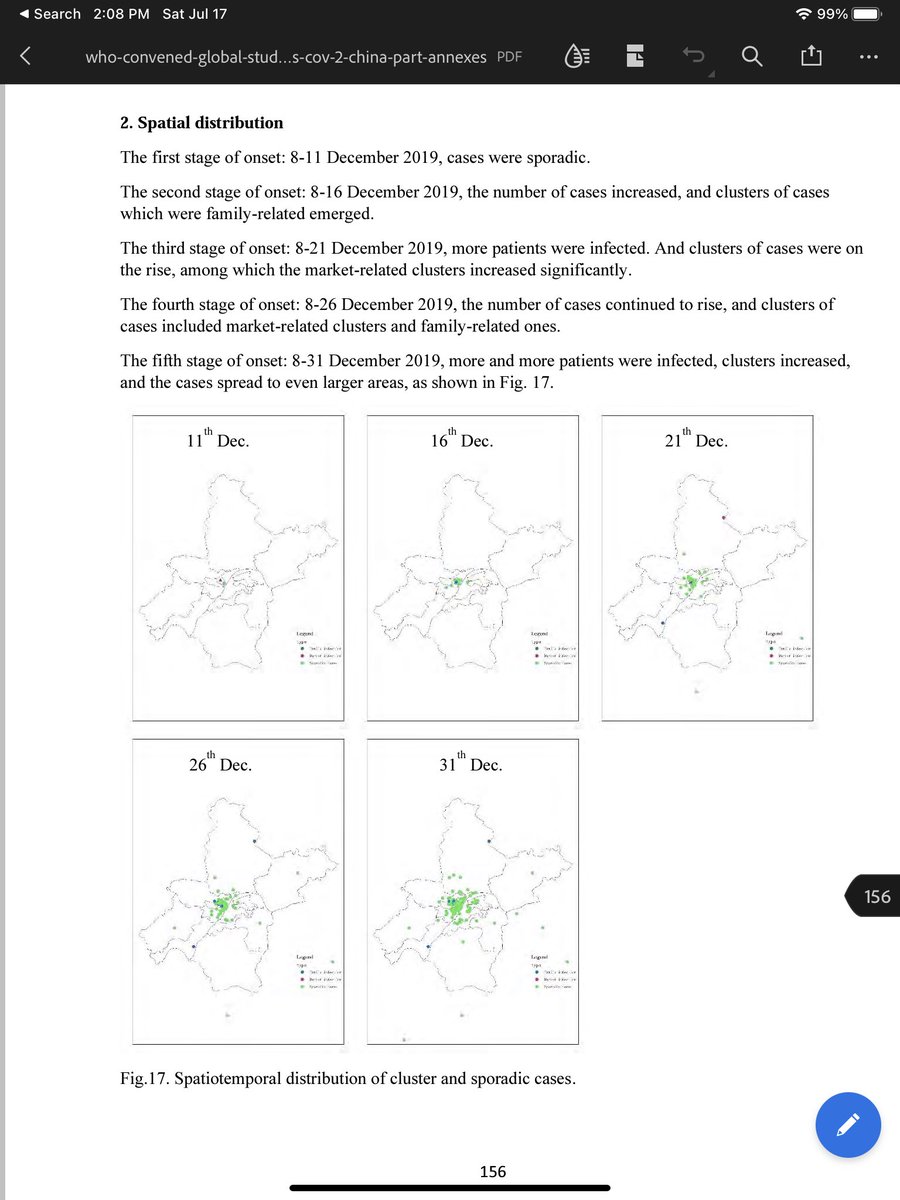
Fig 17 of Annex E of the WHO-Convened Global Study of Origins of SARS-CoV2: China Part
who.int/publications/i…
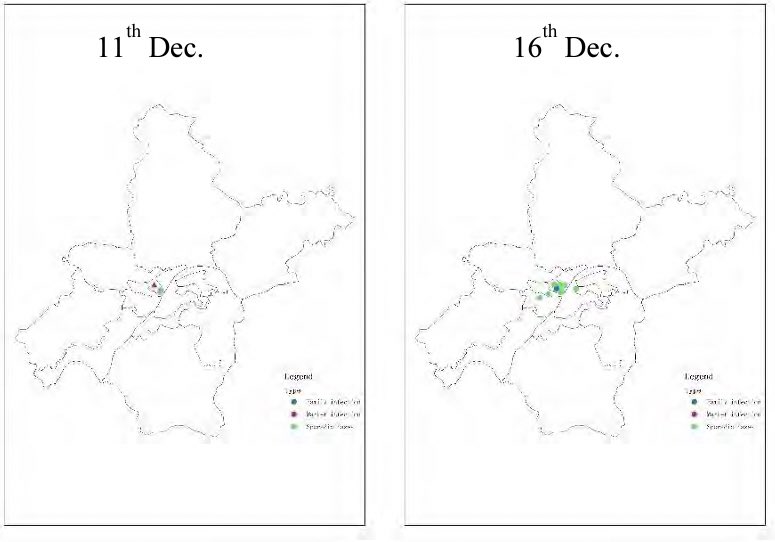
Fig 17 is extremely low-resolution, as shown below.
The red triangle symbol is the Huanan Seafood Market.
Fig 17 of Annex E of the WHO-Convened Global Study of Origins of SARS-CoV2: China Part
who.int/publications/i…
Fig 17 is extremely low-resolution, as shown below.
The red triangle symbol is the Huanan Seafood Market.
4. The dots were laboriously traced from Fig 17 using illustration software, as shown below. This is a screen-grab from a github site which was linked to the preprint version of the article; the illustration shown below is no longer available. 

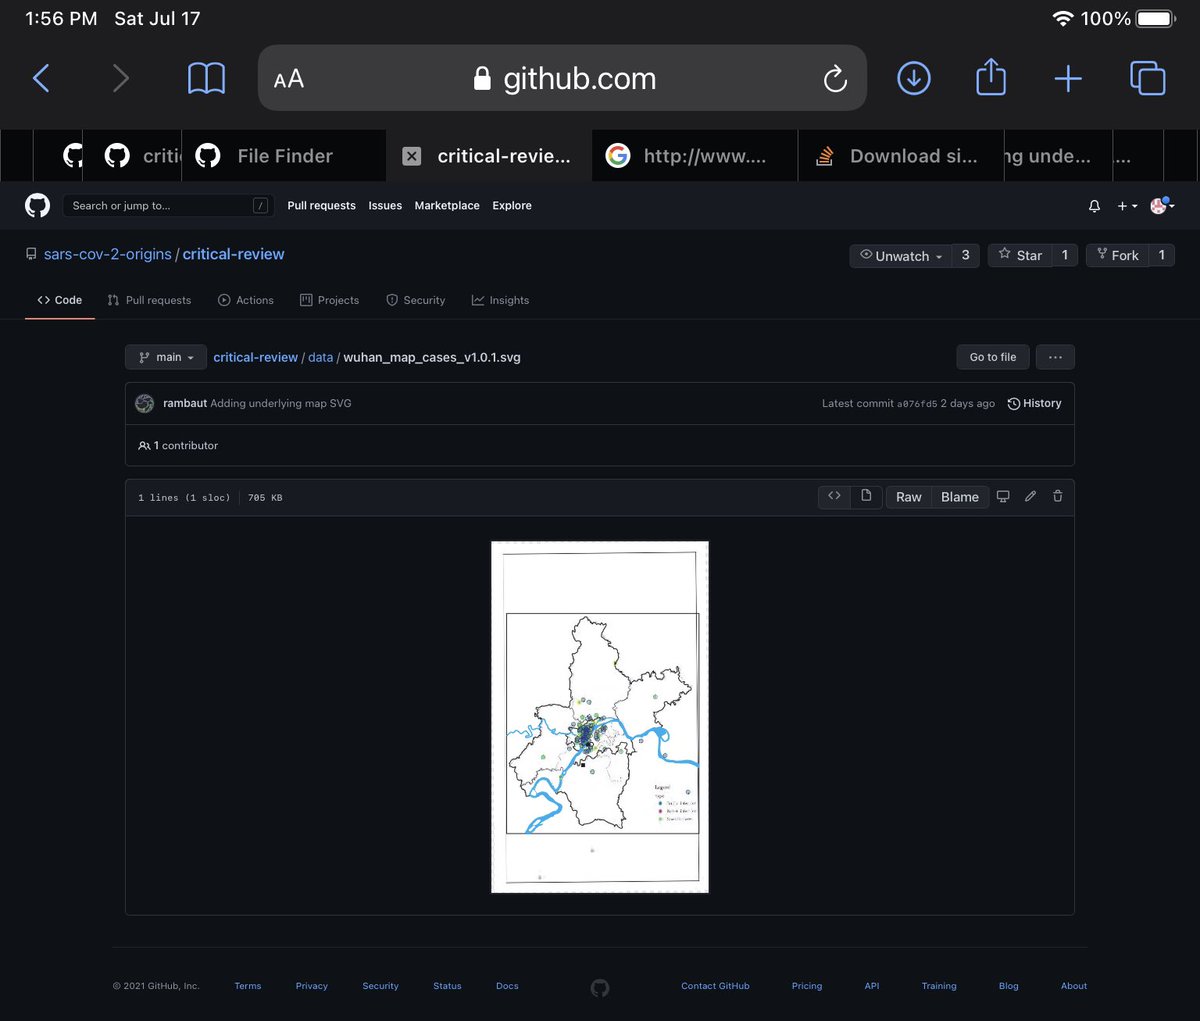
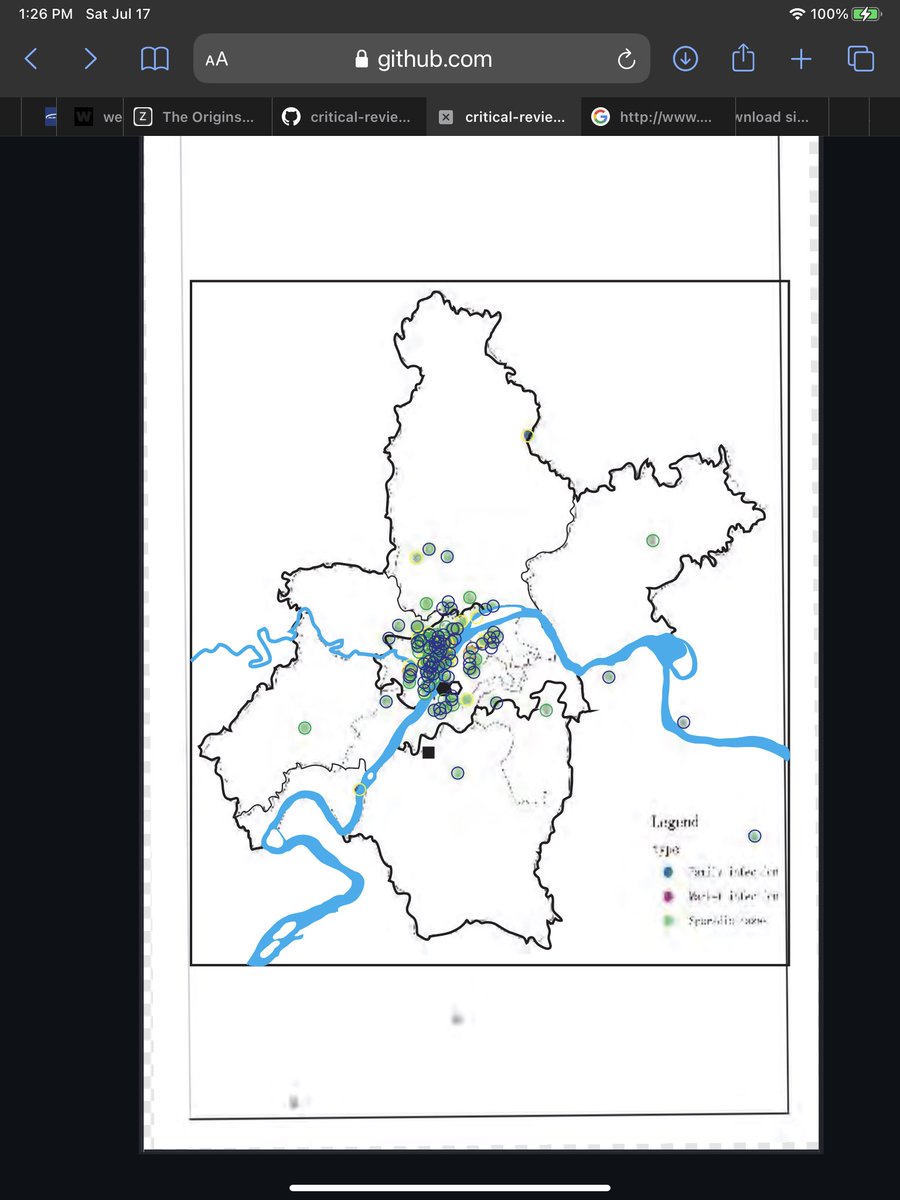
5. A description of the map-making process is provided in the Supplemental Information for Holmes et al. 2021 at cell.com/cms/10.1016/j.… 
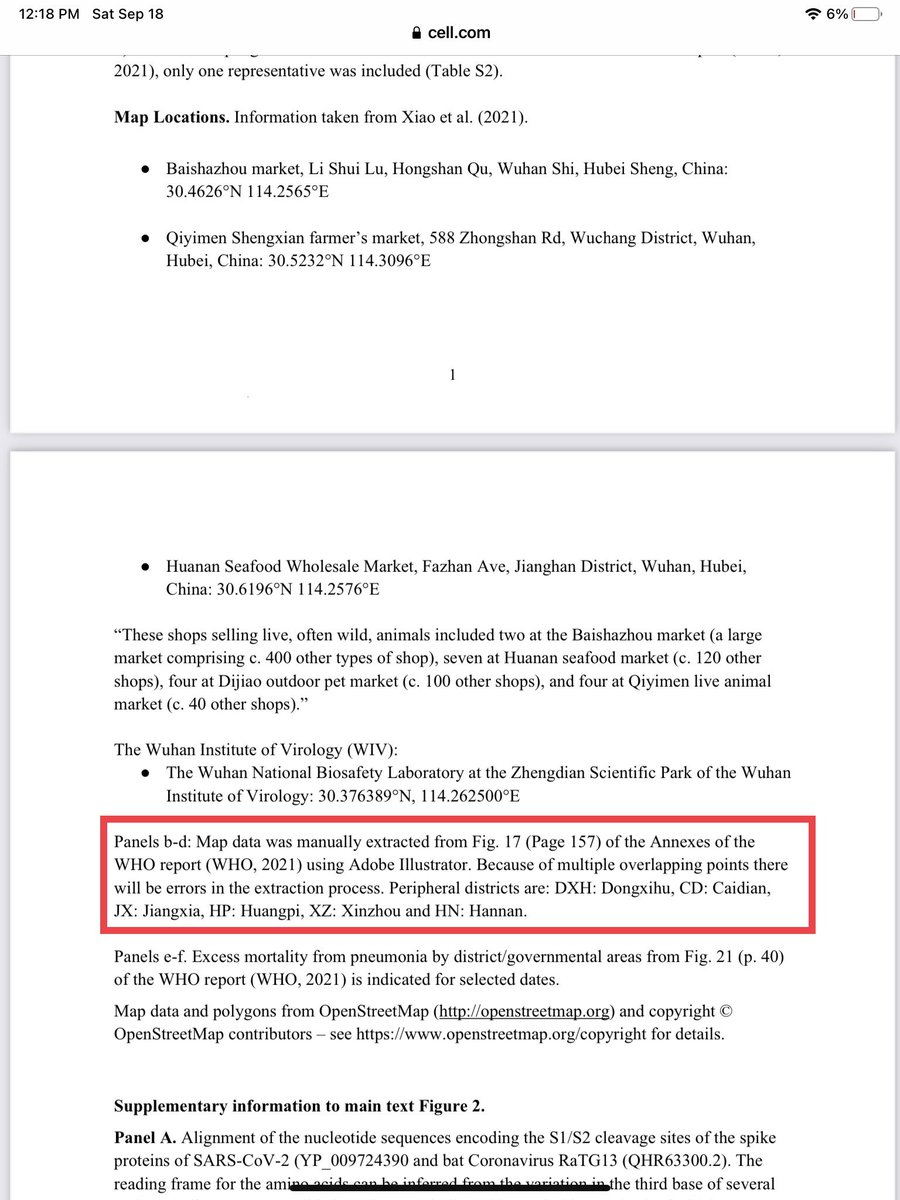
6. Note: Tracing data from another map is a last resort. In modern map-making with GIS, a database is compiled with a row for each point; each row includes x and y coordinates for the point, and all data associated with the point. The GIS software converts this to dots on a map.
7. Annex E of the WHO report has its own deficiencies, including a certain vagueness and failure to include the raw data. These are not addressed in this thread. WHO has acknowledged that there were errors in the report; these errors affected Fig 17.
washingtonpost.com/world/asia_pac…
washingtonpost.com/world/asia_pac…
8. The legend of Fig 17 is almost illegible, but can be inferred with reference to the text.
🔵 Family infection
🔴 Market infection (Huanan Seafood Market)
🟢 Sporadic cases
The dots are home addresses of infected persons.
🔵 Family infection
🔴 Market infection (Huanan Seafood Market)
🟢 Sporadic cases
The dots are home addresses of infected persons.
9. The Dec 8-11 panel of WHO Fig 17 shows only 2 dots, both green — sporadic cases. The Dec 8-16 panel shows green and blue dots: sporadic and family infections. Fig 1B of Holmes et al starts with Dec 8-16, and does not distinguish among sporadic/family/market cases. 

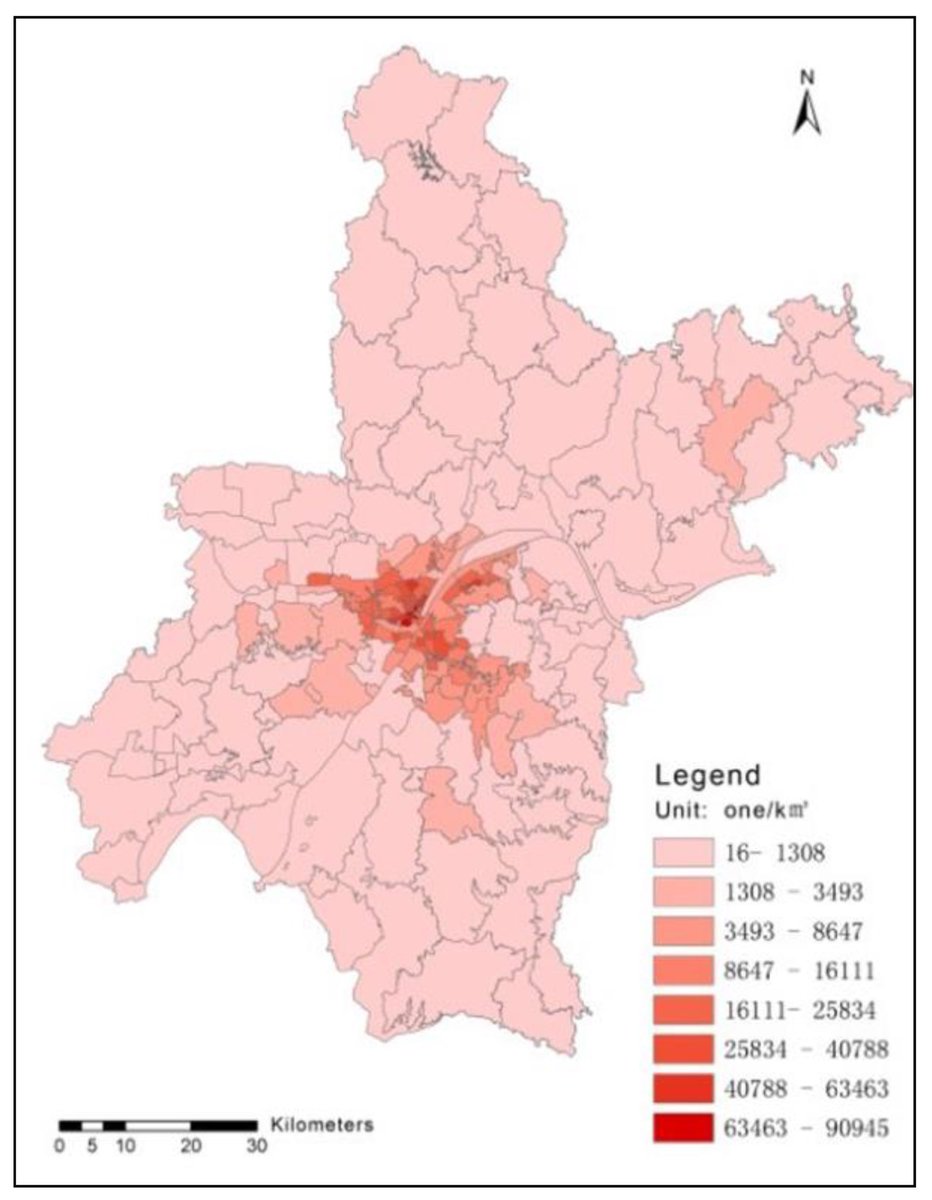
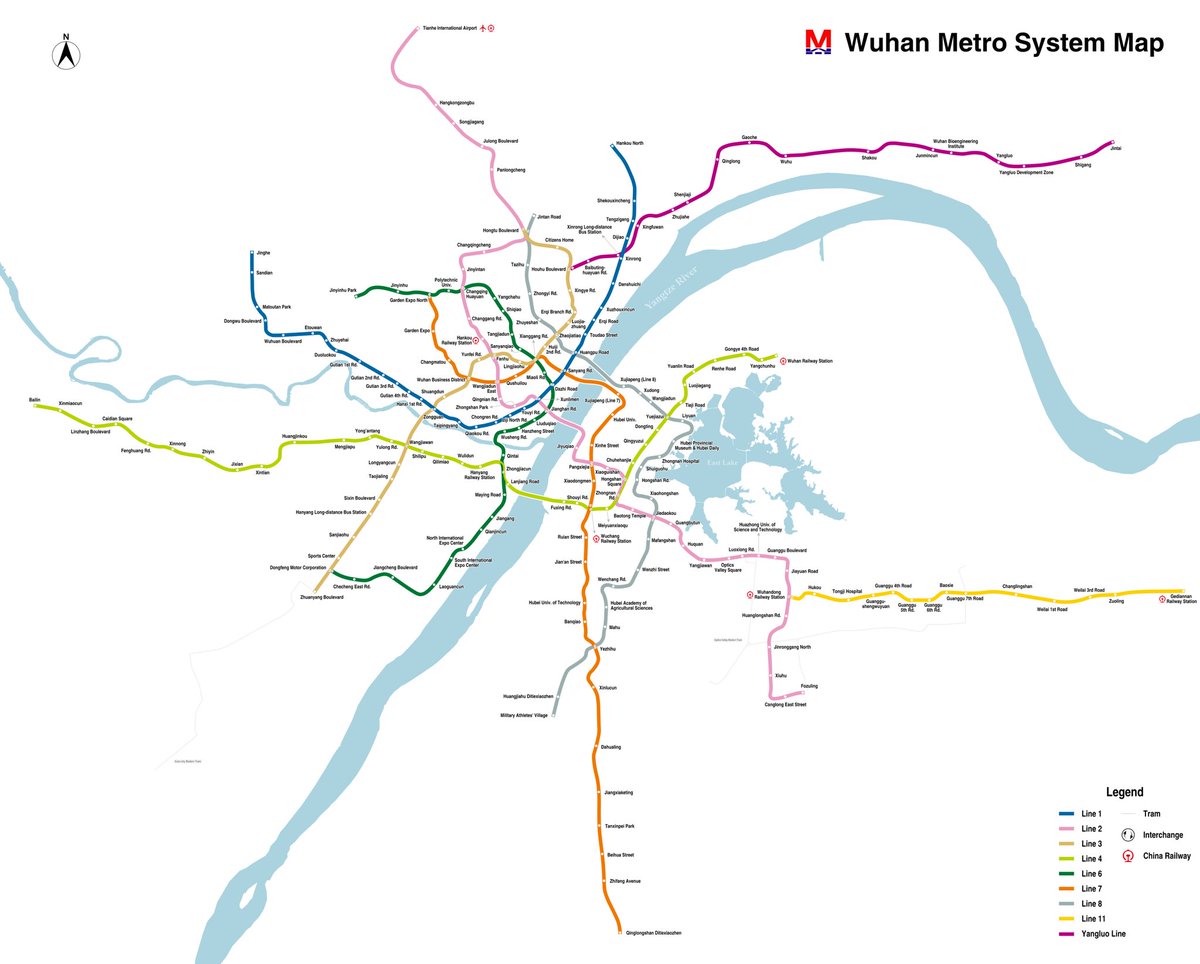
11. Wuhan has extensive road, rail and metro networks. The metro had 2019 daily ridership of 1.3 million. There are multiple river crossings. These networks are not shown on Fig 1B-H. 

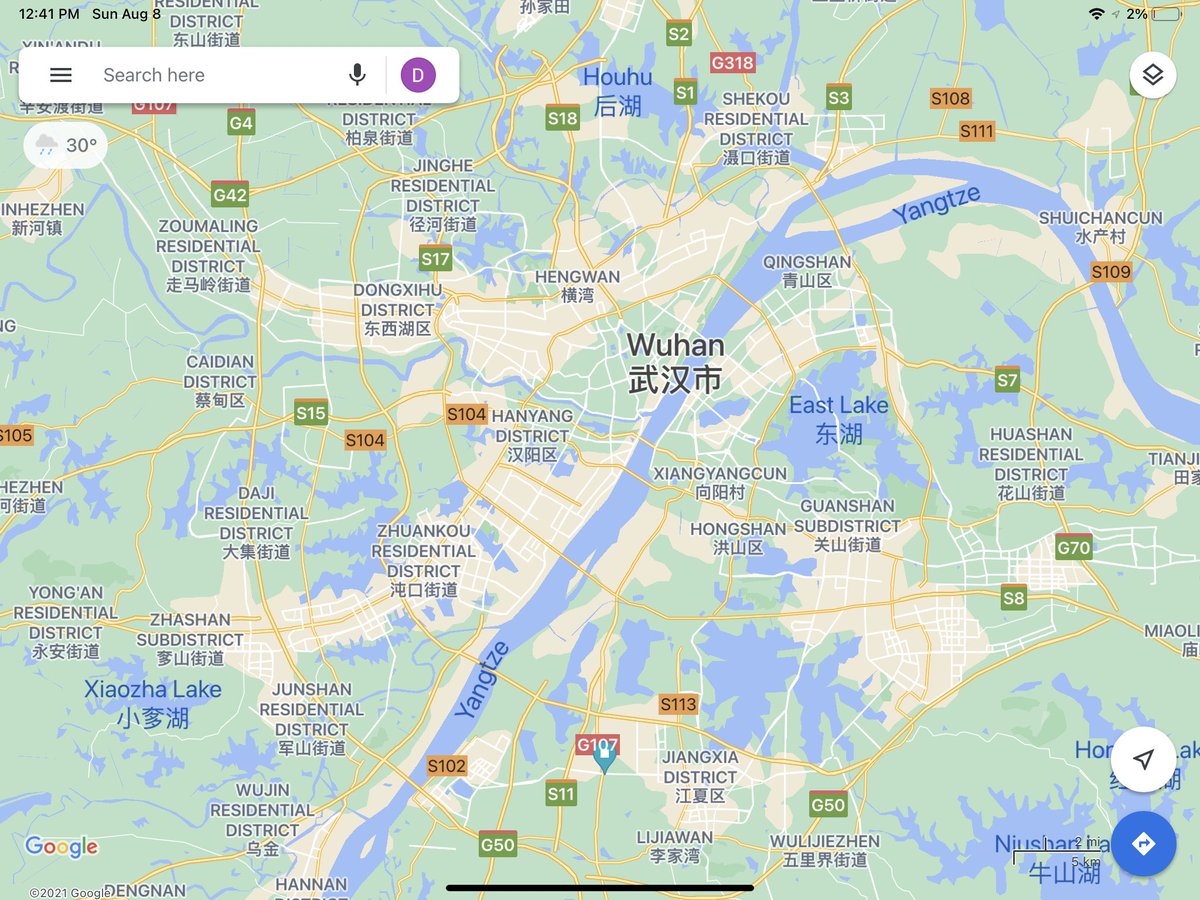
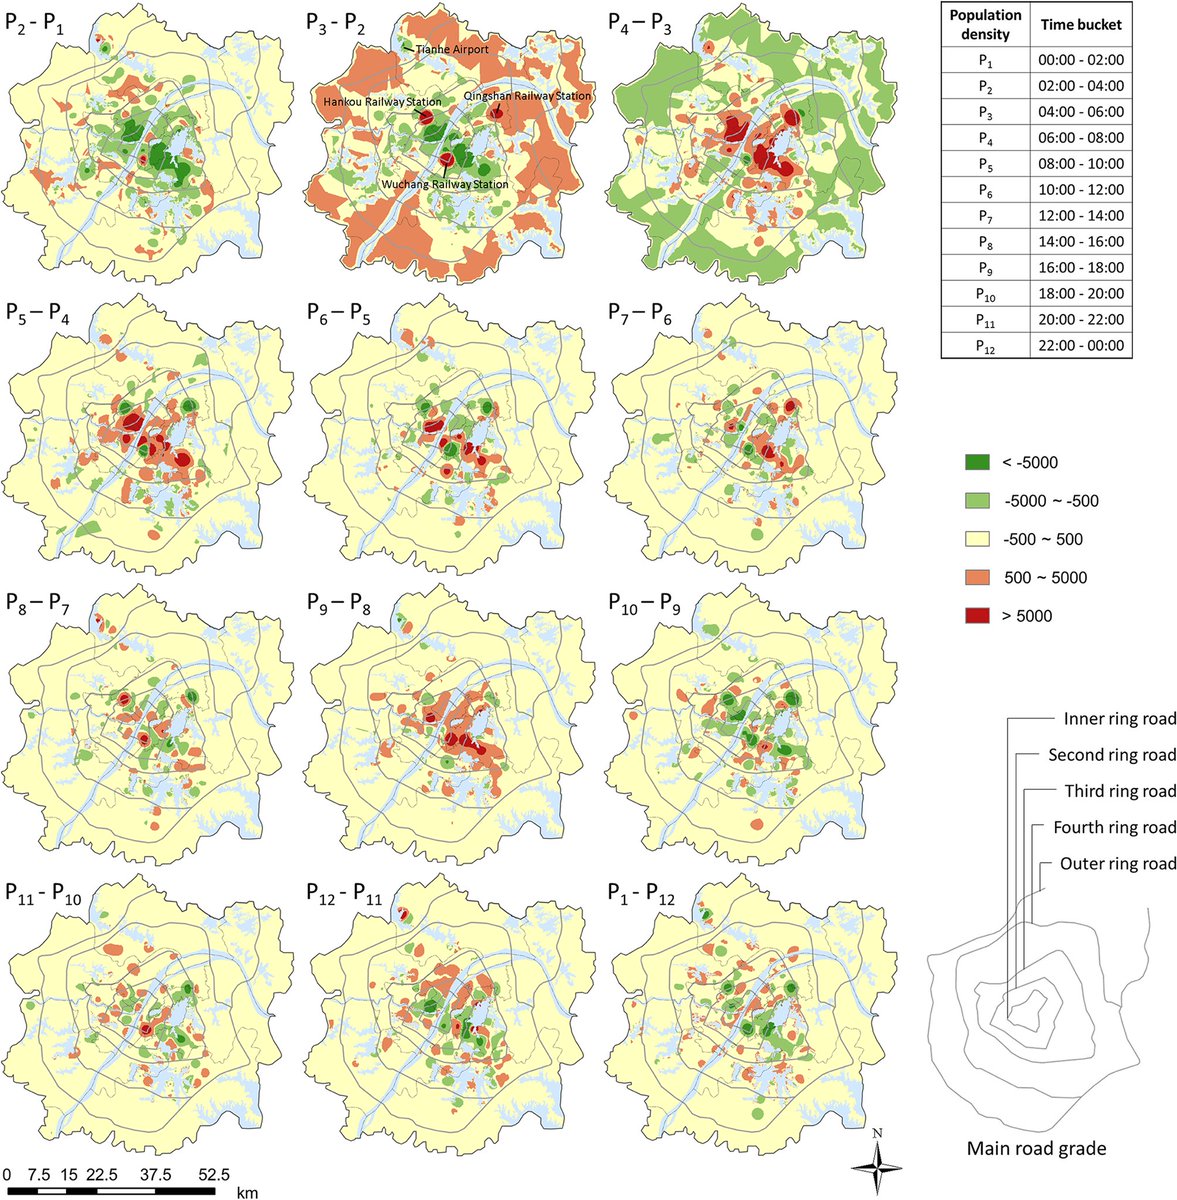
12. Consider the spatial pattern of daily population movements in Wuhan, as researched using using cell phone location data, for 2015. Red: people are entering an area. Green: people are leaving an area. Yellow: little change. journals.plos.org/plosone/articl… 
13. Figure 1B-H omit several locations where bat/coronavirus research was conducted. The locations and relevance of bat/coronavirus research in Wuhan is beyond the scope of this thread. For a compilation of these locations, refer to google.com/mymaps/viewer?…, courtesy @gdemaneuf
14. With the above in mind, consider the section of text in Holmes et al that refers to Fig1B-H. The statement that most early cases cluster around the Huanan market is supported by superficial inspection of Fig 1B-E, but falls apart under detailed scrutiny, as discussed below. 

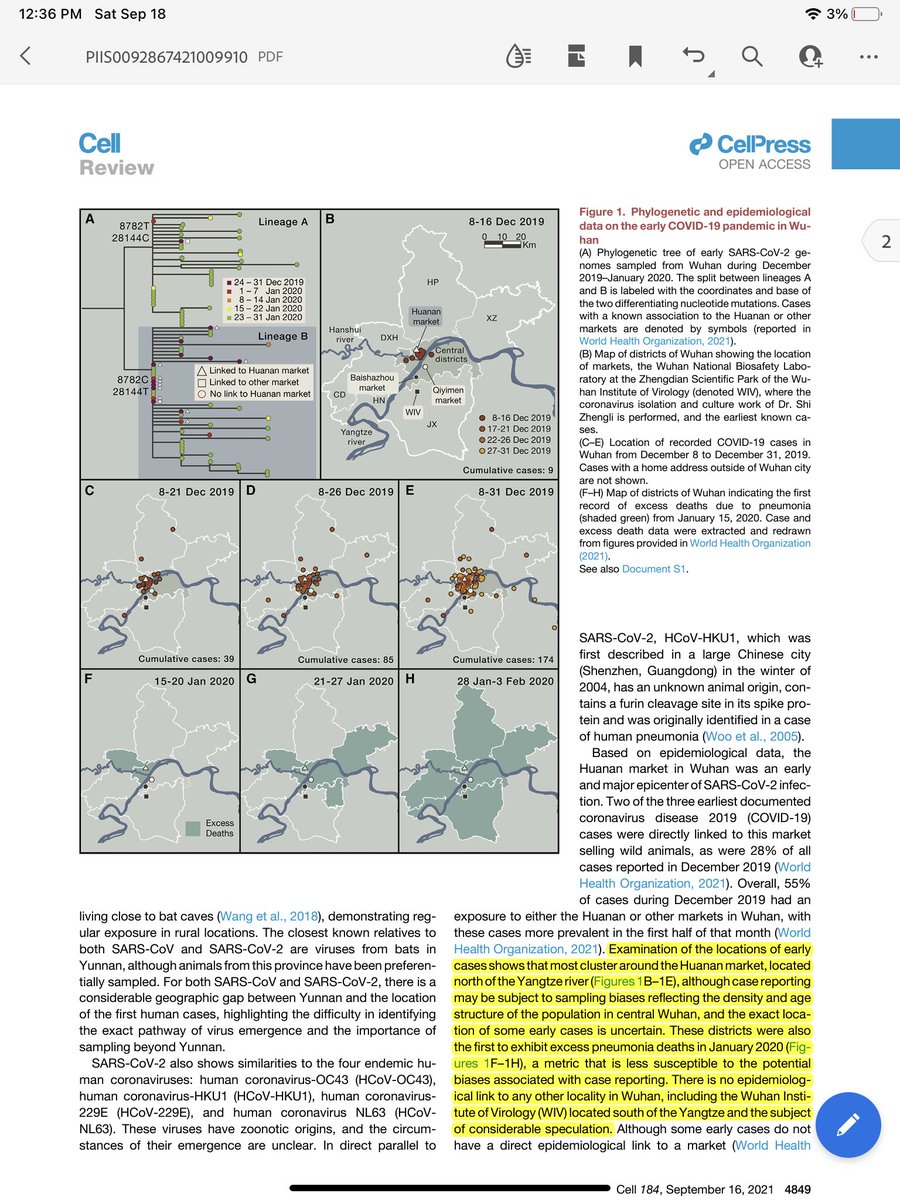
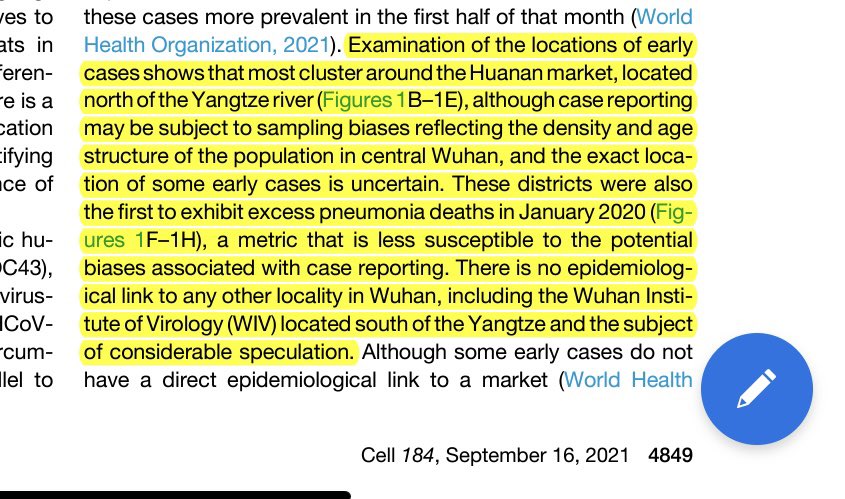
15. Each dot is a home address. Using the home addresses of infected persons to pinpoint the origin point of an epidemic made sense for John Snow in his investigation of the 1854 London cholera epidemic; most people were limited to walking. But it does not work for Wuhan in 2019
16. People move around in a big city, especially for work.
Any given person could have acquired the infection at a location several km or even 10s of km from their home address.
⭕️A map of home addresses of infected persons cannot reveal the origin point⭕️
Any given person could have acquired the infection at a location several km or even 10s of km from their home address.
⭕️A map of home addresses of infected persons cannot reveal the origin point⭕️
17. The apparent clustering around the Huanan market is confounded by a number of factors, including:
▪️Each dot is ~2km in diameter, resulting in a cloud of overprinted dots
▪️Data for Dec 8-11 are not shown separately
▪️Errors in the location data for early cases
▪️Each dot is ~2km in diameter, resulting in a cloud of overprinted dots
▪️Data for Dec 8-11 are not shown separately
▪️Errors in the location data for early cases
18. One could as easily say that the dots cluster around the Hankou railway station (a major commuter hub) or the Wuhan CDC (lab doing bat research). Both are located <1 km from the Huanan market. At the scale of Fig1B-E, both would plot within the triangle symbol for the market.
19. The distinction between the Huanan market on the N side of the Yangtze River and the WIV (Jiangxi campus) on the S side is irrelevant. There are multiple river crossings by road, rail and metro. It is not a barrier to the spread of COVID.
20. In the end, Fig1B-E show us the pattern of home addresses of early COVID patients, spreading over time through the area of the highest population density and the corresponding convergence of transportation lines.
⭕️This tells us nothing about the origin point of COVID.⭕️
⭕️This tells us nothing about the origin point of COVID.⭕️
21. Similarly, we learn nothing about the origin point from Fig 1F-H: patterns of excess mortality, beginning Jan 15, 2020. These are also home addresses. All we see is a pattern spreading outwards from the area of highest population density. Anyways, Jan 15 is a bit late…
22.This article was signed by 21 distinguished and intelligent authors. I hope that some of them can review Fig 1B-H and recognize that it does not support their argument, and ultimately weakens the case they are trying to make. 

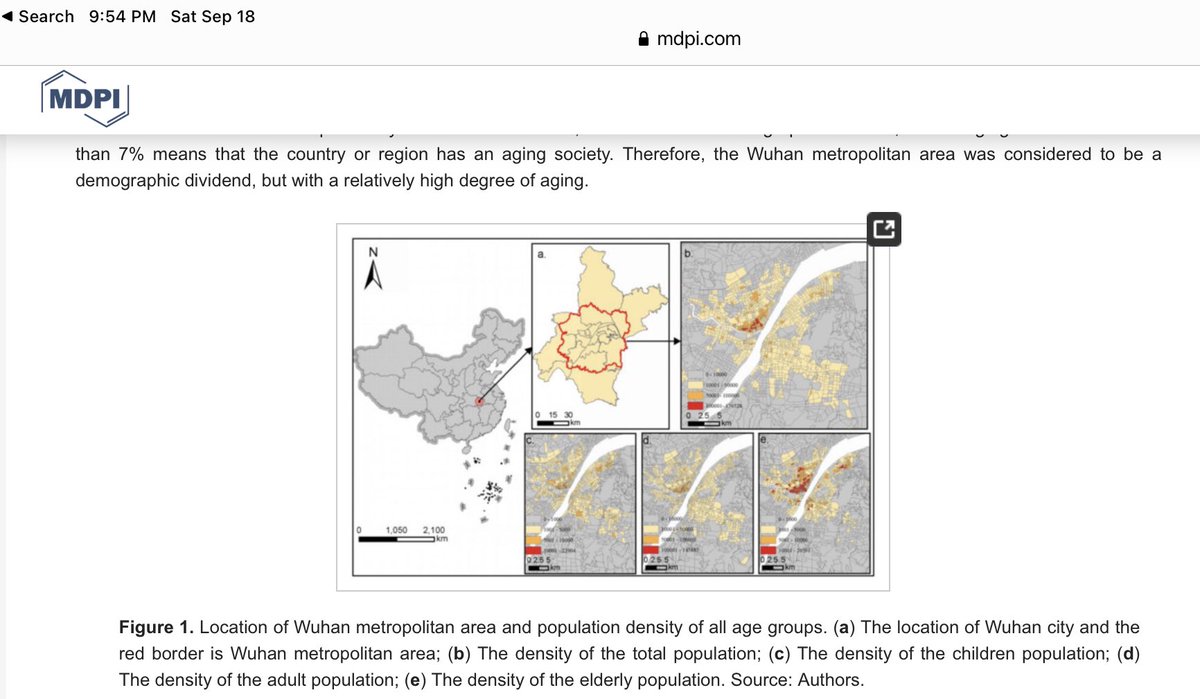
A much better version of the population density map for Wuhan, including breakdown by age. 2017 data.
mdpi.com/2071-1050/12/4…

mdpi.com/2071-1050/12/4…

• • •
Missing some Tweet in this thread? You can try to
force a refresh

