We are setting the stage for a lot of confusion given differences in the future warming projections in the IPCC AR6 and the latest generation of models (CMIP6). For example, here are future projections for Norway from CMIP6 (dashed) and scaled to AR6 assessed warming (solid):
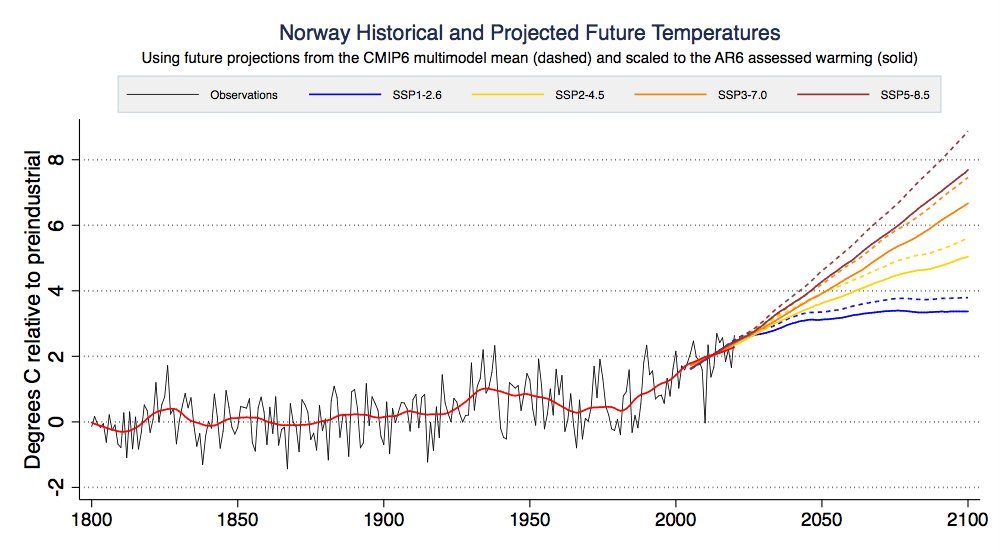
Right now most folks doing assessments would use the dashed lines, even though they are inconsistent with the best estimate of warming in the AR6. This is because there is currently not any gridded future warming projections available that are consistent with AR6 assessed warming
The AR6 took a novel (and I think improved) approach to future warming projections. Rather than simply using the CMIP6 mean, they used three different weighted CMIP6 estimates – with weights based model agreement with observed temperatures over the past few decades.
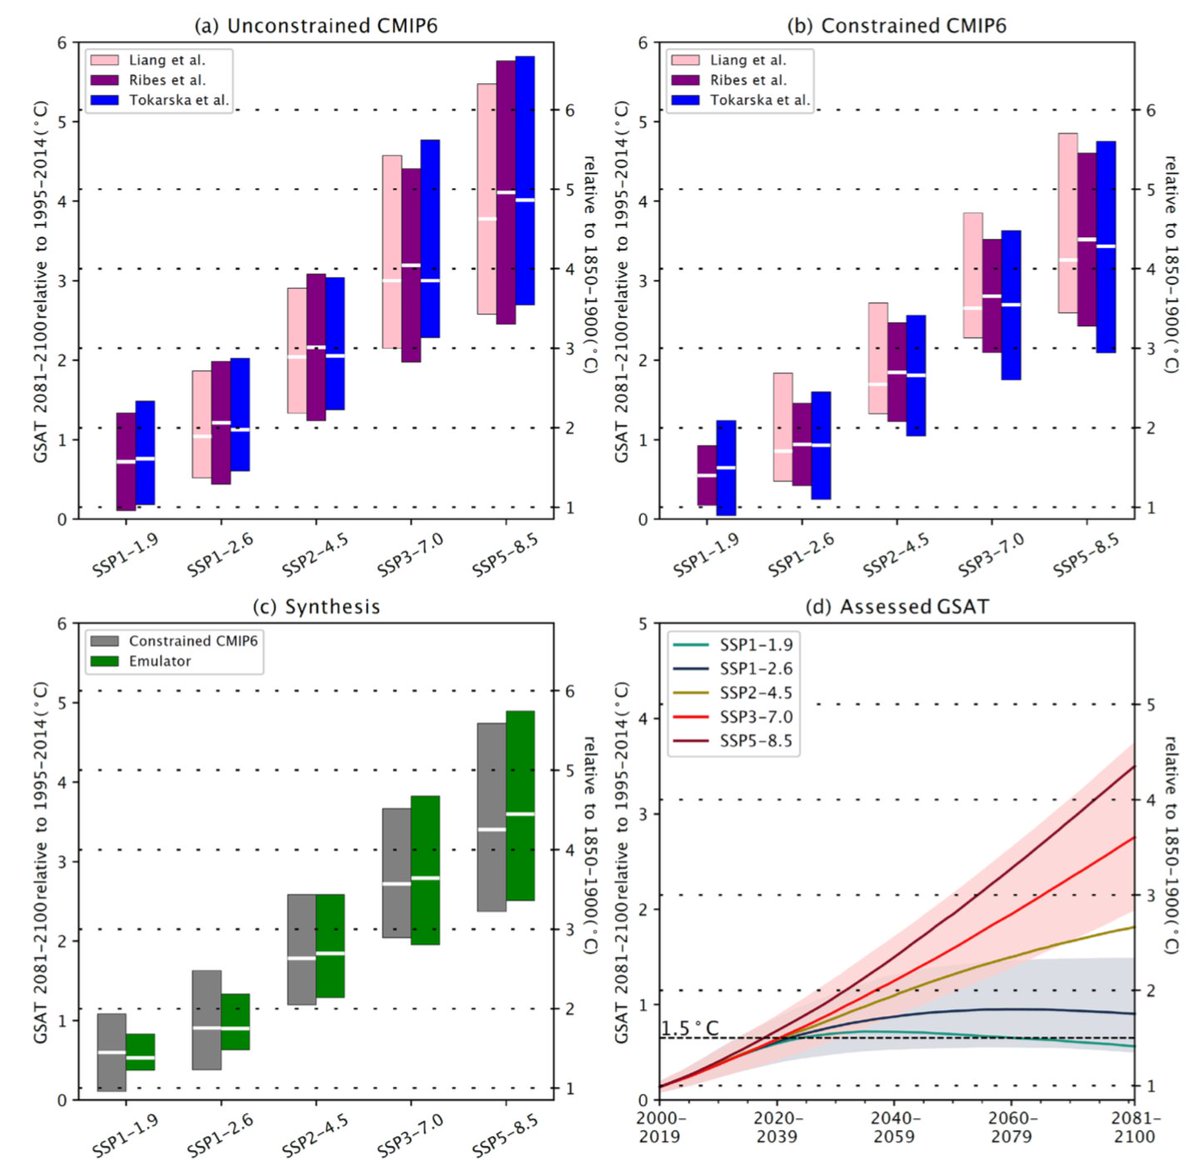
This means that models with too much or too little historical warming were given less weight in the resulting analysis. These three weighted estimates were averaged, and further combined with a simple emulator tuned to the latest climate sensitivity estimates.
This produces warming estimates that are noticeably below those of the CMIP6 multimodel mean – given that very high sensitivity models are given less weight (and are inconsistent with the sensitivity ranges used by the emulator).
To create the figure in at the start of the thread, I've scaled each grid cell in the CMIP6 multimodel mean by the ratio of AR6 assessed GSAT to CMIP6 mean GSAT. This pattern scaling works reasonably well for the mean, but does not provide an easy way to account for uncertainties
What would be useful is if the community could create a set of weights (and pre-calculated weighted fields) in-line with AR6 assessed warming ranges for researchers to use for their own analyses. Otherwise we will see a lot of too-warm unweighted CMIP6 results in future papers.
Accidentally exported a too-small version of the figure at the start of the thread. Here is a crisper version:

• • •

Missing some Tweet in this thread? You can try to force a refresh
 

Keep Current with Dr. Zeke Hausfather

Dr. Zeke Hausfather Profile picture

Stay in touch and get notified when new unrolls are available from this author!

Read all threads

This Thread may be Removed Anytime!

PDF

Twitter may remove this content at anytime! Save it as PDF for later use!

Try unrolling a thread yourself!

how to unroll video
  1. Follow @ThreadReaderApp to mention us!

  2. From a Twitter thread mention us with a keyword "unroll"
@threadreaderapp unroll

Practice here first or read more on our help page!

More from @hausfath

29 Sep
If the proposed Clean Energy Performance Program becomes law it will severely penalize utilities for closing existing nuclear plants. We estimate that closing the Diablo Canyon plant would cost PG&E somewhere between $500 million and $1.5 billion: thebreakthrough.org/issues/energy/…
CEPP awards utilities with a payment of $150 per MWh for an increase in year-over-year clean energy generation of over 1.5 percentage points if the total increase year-over-year exceeds 4 percentage points.
For example, if a utility had 20% of the electricity generation from clean sources in 2022, and increased that to 24% in 2023, they would be eligible for a payment of $150 per MWh for 2.5% (4% minus 1.5%) of their total generation.
Read 13 tweets
13 Sep
As the world adopts climate policies and the price of clean energy falls, we have and will continue to move away from some of the worst climate outcomes of 4C+ warming. But this should not distract us from our ultimate goal of getting emissions to net-zero thewellnews.com/in-the-news/we…
A decade ago the world seemed on track for a very dark climate future. Global emissions were increasing at 3% per year, China was building a new coal plant every three days, and the idea that emissions could double or triple by 2100 did not seem that far-fetched.
Today things have changed markedly. Global coal use peaked back in 2013, and the International Energy Agency’s (IEA) most recent World Energy Outlook suggests that coal is now in “structural decline.” Global emissions are still increasing, but at a rate of only 1% per year.
Read 15 tweets
2 Sep
For every 1C of warming the world experiences, saturated air contains 7 percent more water vapor on average.
Per the IPCC AR6: "The frequency and intensity of heavy precipitation events have increased since the 1950s over most land area for which observational data are sufficient for trend analysis (high confidence), and human-induced climate change is likely the main driver."
"Event attribution studies and physical understanding indicate that human-induced climate change increases heavy precipitation associated with tropical cyclones (high confidence)."
Read 6 tweets
27 Aug
One under-appreciated finding in the IPCC AR6 is a lot more certainty around future warming.

Previously IPCC only gave "likely" warming ranges (e.g. a 2 in 3 chance of falling in the range). New report gives "very likely" 9 in 10 ranges. Here is a rough like-to-like comparison: Image
The IPCC AR5 future warming projections were nominally based on the 90th percentile of CMIP5 models, but the assessed range of climate sensitivity was much wider than the range in CMIP5 models, so these were treated "likely" (66th percentile) ranges.
The AR6, on the other hand, bases its warming projections on a combination of observationally-constrained CMIP6 models and a simple energy balance model using the new transient climate response (TCR) and equilibrium climate sensitivity (ECS) values in the report. Image
Read 9 tweets
19 Aug
Theres been a lot of debate about which simple metrics are best when comparing climate impacts of CH4 and CO2. The new IPCC AR6 report has a great figure (7.22) that compares different approaches. Ultimately, you want to come as close as possible to the actual temperature (GSAT):
Its pretty clear the optimal approach is GWP*. However, GWP* is a bit more complex and lacks constant equivalence (e.g. CH4 is always x times worse than CO2). Unfortunately given differing atmospheric lifetimes constant equivalence is not very accurate. carbonbrief.org/guest-post-a-n…
If you are going to use GWP-20 or GWP-100, the IPCC AR6 figure suggests that GWP-20 will significantly overestimate near-term warming of continued emissions of CH4, while GWP-100 will modestly underestimate warming.
Read 5 tweets
11 Aug
The recent IPCC report had a big focus on methane (CH4) – and rightly so. We should work to cut methane emissions quickly, but not at the expense of cutting CO2.

Methane is temporary, while CO2 is forever.

A quick thread: 1/13
Methane is a strong greenhouse gas – over 100x more effective at trapping heat than CO2 while its in the atmosphere. Its responsible for around 28% of positive radiative forcing (and historical warming). 2/
However, methane has a short atmospheric lifetime. Most of the methane we emit this year will be gone from the atmosphere in around a decade. Methane interacts with hydroxyl radicals (OH) in the atmosphere, and ultimately breaks down into (mostly) CO2 and H2O. 3/
Read 14 tweets

Did Thread Reader help you today?

Support us! We are indie developers!


This site is made by just two indie developers on a laptop doing marketing, support and development! Read more about the story.

Become a Premium Member ($3/month or $30/year) and get exclusive features!

Become Premium

Too expensive? Make a small donation by buying us coffee ($5) or help with server cost ($10)

Donate via Paypal Become our Patreon

Thank you for your support!

Follow Us on Twitter!

:(