Moving Averages is a common indicator which most of us (novice/professional) use in the stock market for trading and investment.
This learning thread would be on
"𝙐𝙨𝙚𝙨 𝙤𝙛 𝙈𝙤𝙫𝙞𝙣𝙜 𝘼𝙫𝙚𝙧𝙖𝙜𝙚"
Like👍 & Retweet🔄 for wider reach and more such learning thread.
1/10
This learning thread would be on
"𝙐𝙨𝙚𝙨 𝙤𝙛 𝙈𝙤𝙫𝙞𝙣𝙜 𝘼𝙫𝙚𝙧𝙖𝙜𝙚"
Like👍 & Retweet🔄 for wider reach and more such learning thread.
1/10
Basics of the moving average:
It takes average of the price for the duration we want.
So 10 days moving average means an average price of 10 days closing price.
Common types of Moving Average:
Simple, Exponential, Weighted.
Use only one type in your trading setup.
2/10
It takes average of the price for the duration we want.
So 10 days moving average means an average price of 10 days closing price.
Common types of Moving Average:
Simple, Exponential, Weighted.
Use only one type in your trading setup.
2/10

Different uses:
1⃣ Moving Average Crossovers:
Common strategy used by positional traders and investor in finding multibagger or good returns stocks.
Common crossover used is for 50 & 200 Moving Average.
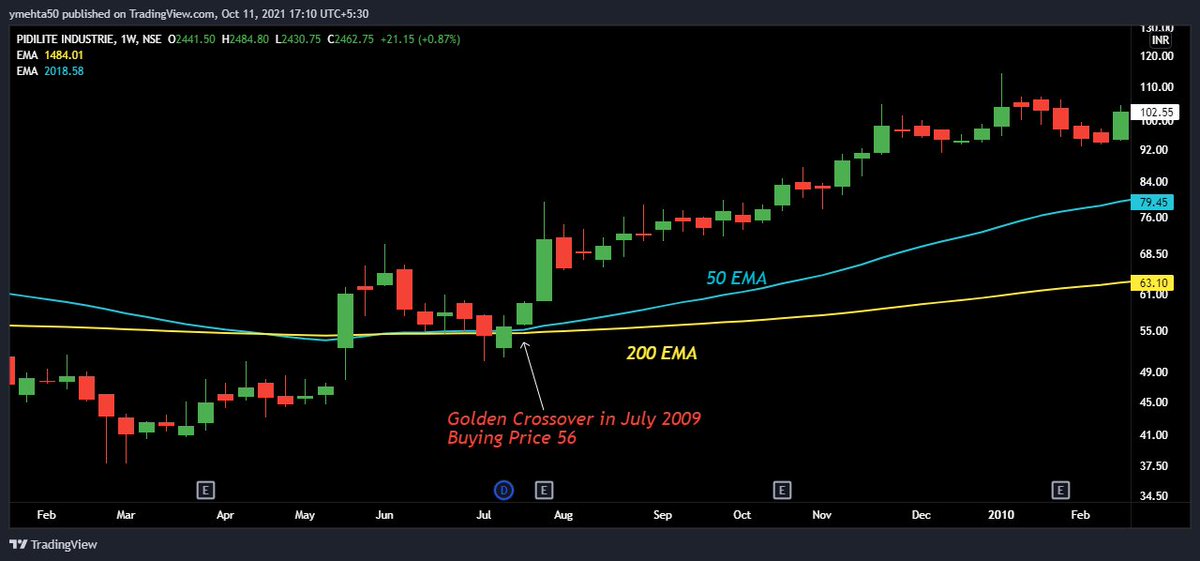
Also, this is called as "𝗚𝗼𝗹𝗱𝗲𝗻 𝗖𝗿𝗼𝘀𝘀𝗼𝘃𝗲𝗿"
3/10
1⃣ Moving Average Crossovers:
Common strategy used by positional traders and investor in finding multibagger or good returns stocks.
Common crossover used is for 50 & 200 Moving Average.
Also, this is called as "𝗚𝗼𝗹𝗱𝗲𝗻 𝗖𝗿𝗼𝘀𝘀𝗼𝘃𝗲𝗿"
3/10
In this buy signal is initiated when lower MA (50 EMA) crosses above higher MA (200 EMA).
And exit or sell signal is intiated when lower MA (50 EMA) crosses below higher MA (200 EMA).
4/10
And exit or sell signal is intiated when lower MA (50 EMA) crosses below higher MA (200 EMA).
4/10
Let's see an example:
Pidilite Industries
Buying Price was 56 in 2009 and CMP is 2462 and still there is no selling signal.
44 times Multibagger or 4300% returns.
In lower time frame, it will give more whipsaw and more number of trades.
5/10
Pidilite Industries
Buying Price was 56 in 2009 and CMP is 2462 and still there is no selling signal.
44 times Multibagger or 4300% returns.
In lower time frame, it will give more whipsaw and more number of trades.
5/10

Setup looks easy, but is not that easy.
Sometimes stock stays in consolidation and it gives frequent buy and sell signal as seen in Airtel.
One way to avoid this noise is to use price action and look for the breakouts and then trade.
6/10
Sometimes stock stays in consolidation and it gives frequent buy and sell signal as seen in Airtel.
One way to avoid this noise is to use price action and look for the breakouts and then trade.
6/10

2⃣ Support or Resistance
Moving averages can act as support or resistance to stocks.
Let's look at an example where it acted as a support.
In #IEX chart, 100 Days EMA acted as a support multiple times.
Also, a live trade was shared on IEX:
7/10
Moving averages can act as support or resistance to stocks.
Let's look at an example where it acted as a support.
In #IEX chart, 100 Days EMA acted as a support multiple times.
Also, a live trade was shared on IEX:
https://twitter.com/YMehta_/status/1397993803756101634
7/10

Let's look at an example where it acted as a Resistance.
Suzlon:
Stock faced resistance at 100 days EMA and it kept going down after EMA level.
Stock went down from 105 to 20 in two years.
8/10
Suzlon:
Stock faced resistance at 100 days EMA and it kept going down after EMA level.
Stock went down from 105 to 20 in two years.
8/10

3⃣ Finally Moving Average can be used as a Stoplosses.
~ For a buyer, if price closes below a crucial moving average, then buy position is closed in stocks.
~ For a seller, if price closes above a crucial moving average, then short position is closed in stocks.
9/10
~ For a buyer, if price closes below a crucial moving average, then buy position is closed in stocks.
~ For a seller, if price closes above a crucial moving average, then short position is closed in stocks.
9/10
I hope everyone got a taste of how moving average can be used.
These are not a universal rules one must follow. One can create their rule or follow someone else rules.
Only important thing is one must follow a fix rule instead of tweaking or changing setup frequently.
10/10
These are not a universal rules one must follow. One can create their rule or follow someone else rules.
Only important thing is one must follow a fix rule instead of tweaking or changing setup frequently.
10/10
• • •
Missing some Tweet in this thread? You can try to
force a refresh


