New CPI numbers are out. As usual, doesn't settle any arguments but broadly supportive of the view that: (1) inflation is slowing and (2) inflation remains high.

Notably inflation is slowing less than forecasters or the FOMC expected, could be due to supply chains or demand.
The unusually rapid inflation in autos and has ended (but prices have yet to fall, they probably will at least somewhat) and pandemic-services prices were down (e.g., travel). BUT, everything else maintained its pace of the previous six months. A pace ≈3% inflation.
We saw a sizable increase in shelter prices in September (can't blame supply chains for that), but still a lot of room to rise faster because: (1) below trend; (2) other measures show faster increases; and (3) it generally lags (for real and methodological reasons).
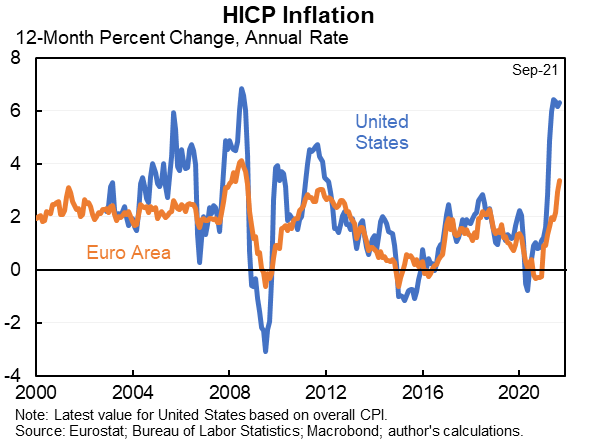
Your monthly reminder that: (1) inflation has risen everywhere and (2) inflation has risen much more in the United States than elsewhere. The 24-month graph shows that in Europe inflation is largely base effects, but we're well past that here.
The Fed targets a different measure of inflation that will be released later this month. But using today's measure to predict that one shows we'll need a large slowdown in inflation in the next three months to hit their median forecast.
I continue to believe there is massive uncertainty but if forced to pick a number for core PCE would say about 4% for this year and about 3% for next year. Most forecasters are slightly below me on the former and well below me on the later. But they've also been revising up.

• • •

Missing some Tweet in this thread? You can try to force a refresh
 

Keep Current with Jason Furman

Jason Furman Profile picture

Stay in touch and get notified when new unrolls are available from this author!

Read all threads

This Thread may be Removed Anytime!

PDF

Twitter may remove this content at anytime! Save it as PDF for later use!

Try unrolling a thread yourself!

how to unroll video
  1. Follow @ThreadReaderApp to mention us!

  2. From a Twitter thread mention us with a keyword "unroll"
@threadreaderapp unroll

Practice here first or read more on our help page!

More from @jasonfurman

13 Oct
This is a strange argument. For months @paulkrugman urged us to look at median CPI instead of core CPI. Here is what this graph looks like with median CPI.

(Median CPI has risen for three consecutive months & in September was tied for the highest on record, data go back 38 yrs.)
Here are links to @paulkrugman's previous explanations of why median CPI is better than core CPI (nytimes.com/2021/04/16/opi… and ) and the Cleveland Fed's explanation of median CPI. clevelandfed.org/our-research/i…
And I should add, I'm not a big fan of median CPI--I've looked into its inertial forecasting properties and they're no better than core CPI (and neither are very good, we have lots and lots of other info). I prefer to stick with basic numbers instead of risk cherrypicking.
Read 4 tweets
12 Oct
Measured productivity growth up a lot in the US in the wake of COVID, is flat or down in other major advanced economies.

I would like to understand this better, my hunch is more about short-run macro dynamics around output/employment than a durable technological shift. A 🧵.
I see three possible explanations (and there could be others too):

1. Shifts in composition of production/employment

2. A temporary macro phenomenon (will explain)

3. A long-lasting shift.
1. COMPOSITION explains part of the US productivity increase. If a lot of lower-wage and lower-productivity workers lose their jobs then even if no one else's productivity changes the average will still go up.

But US productivity is up even adjusted for composition.
Read 15 tweets
11 Oct
I don't like it when people say "science says". Science is a process not a fixed set of answers.

Take the minimum wage. One theory predicts increases reduce employment. Another predicts smaller increases don't reduce employment but larger ones do. Others have different predns.
Thirty years ago the dominant theory was employment reductions and the empirical evidence was a mess. The New York Times editorial page would routinely caution that raising the minimum wage would reduce employment. nytimes.com/1988/02/23/opi…
David Card (winner of the Nobel Prize) together with Alan Kruger studied a natural experiment about NJ vs. PA which upended this conventional wisdom and ushered in a new era of more credible attempts to casually identify the effects of the minimum wage.
Read 10 tweets
11 Oct
A wonderful Nobel for Josh Angrist, David Card & Guido Imbens. In Ec10 we learn about 3 principles of economics: optimization, equilibrium & empiricism. This prize is all about #3. It is about science as a process of discovery not fixed and final answers.
nobelprize.org/prizes/economi…
In many ways economics is harder than the natural sciences because human beings are more complex and the relationships we study are less precise and less stable than what natural scientists study.
Two years ago the Nobel Prize was awarded to Abhijit Banerjee, Esther Duflo, & Michael Kremer for their work on randomized control trials in the area of development--these were deliberately designed experiments to learn in way that has long been standard in the natural sciences.
Read 7 tweets
7 Oct
The infrastructure/reconciliation bills will almost certainly have a negligible medium-to-long-term impact on inflation. It could be a very small positive or a very small negative. This chart is the most important reason why.
The fiscal support was huge in 2020 and even larger in 2021. But the infrastructure and reconciliation bills (or at least President Biden's versions, we don't have budget numbers for Congress' version) are *much* smaller in gross terms and essentially zero in net terms.
The ~$500b from the American Rescue Plan passed in March that is set to spend out next year will continue to put some upward pressure on inflation relative to pre-pandemic rates. But the new legislation is negligible (look at the diamonds).
Read 4 tweets
7 Oct
The reconciliation bill is a small change in the overall level of taxation but a large change in the composition of taxation. A brief🧵putting this in context.

(Note for this thread "reconciliation bill" = House Ways & Means version, will likely change somewhat.)
The reconciliation bill would raise revenue by about 1/2 percent of GDP annually. That is expected to bring revenue to ~18% of GDP. That is well within the historical range and well below previous peaks during periods of low unemployment rates like the one CBO is forecasting.
The bill has large gross changes ($2.1T in raisers & $1.2T in costers) for a much smaller net increase:

High-income & misc increases: $1.1T
Corporate increases: $1.0T
Infrastructure & community development: -$0.1T
Green energy: -$0.2T
Children/safety net: -$0.8T

NET: $0.9T
Read 9 tweets

Did Thread Reader help you today?

Support us! We are indie developers!


This site is made by just two indie developers on a laptop doing marketing, support and development! Read more about the story.

Become a Premium Member ($3/month or $30/year) and get exclusive features!

Become Premium

Too expensive? Make a small donation by buying us coffee ($5) or help with server cost ($10)

Donate via Paypal Become our Patreon

Thank you for your support!

Follow Us on Twitter!

:(