
One of my favorite things to talk about in causal inference is the target *estimand*
🤓 Let's talk about a few different estimands and how to estimate them!
(image cred: @simongrund89)
🤓 Let's talk about a few different estimands and how to estimate them!
(image cred: @simongrund89)

A lot of my research is in the observational study space. This basically mean that participants in the study were not randomly assigned treatments or exposures, but rather we just observe how a certain exposure affects an outcome
♥️ For example: Is a diabetes drug associated with heart disease?
Instead of randomly giving some patients drug A and some drug B, we evaluated the electronic health records of patients who were already taking the drugs & assessed their health after.
lucymcgowan.com/writing/2017_c…
3/
Instead of randomly giving some patients drug A and some drug B, we evaluated the electronic health records of patients who were already taking the drugs & assessed their health after.
lucymcgowan.com/writing/2017_c…
3/
There are some issues with this analysis - since we didn’t randomly assign patients to drug A and drug B, it is possible that doctors selected one drug over the other for certain reasons that reflect patient characteristics
4/
4/
Perhaps healthier patients are often prescribed drug A – this could make it look like those who take drug B are more likely to have heart disease simply based on their pre-treatment characteristics
✨Propensity scores can help to adjust for these pre-treatment characteristics
5/
✨Propensity scores can help to adjust for these pre-treatment characteristics
5/
✨ A propensity score is the probability of being assigned to a certain treatment, conditional on pre-treatment (or baseline) characteristics
Here is a mirrored histogram of propensity scores for treatment (top) and control (bottom) groups
6/
Here is a mirrored histogram of propensity scores for treatment (top) and control (bottom) groups
6/
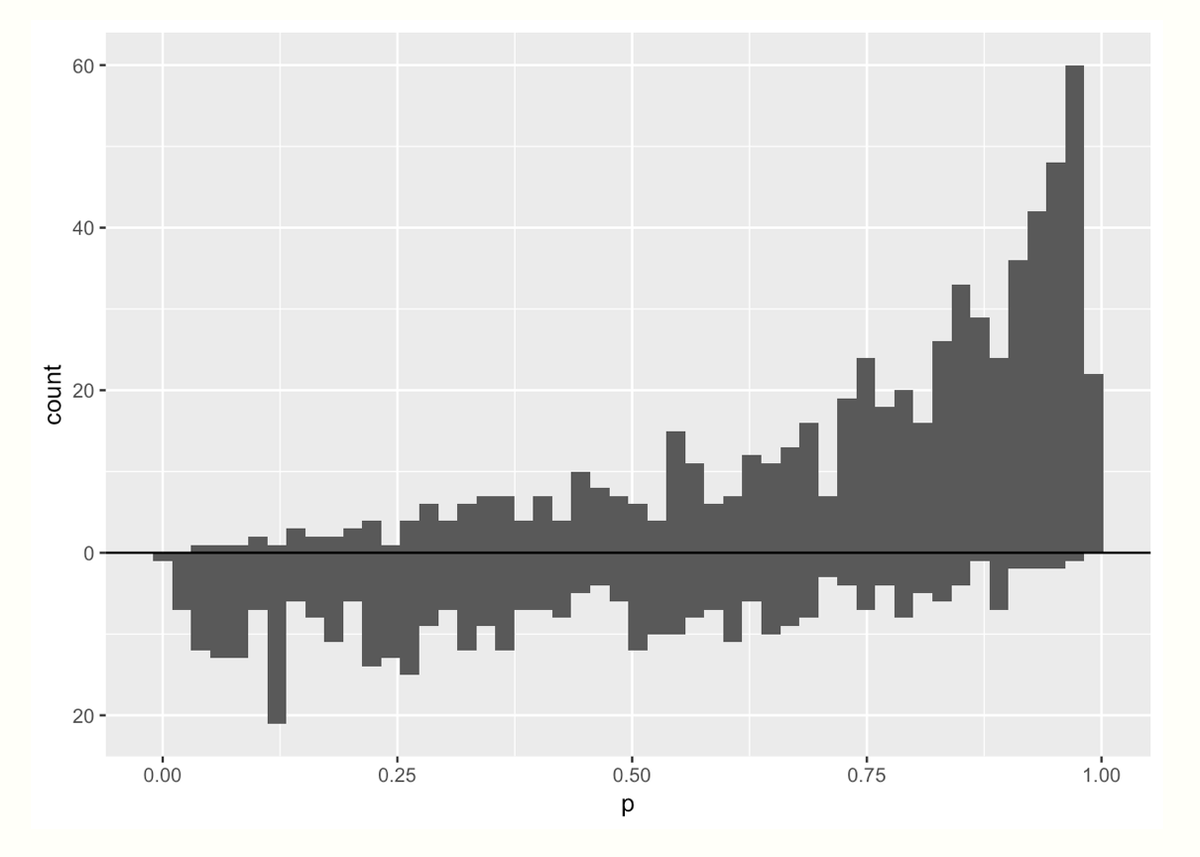
Let's spend a second staring at the graph. Two things jump out to me:
☝️ More mass on the *right* in the treatment group (top) means that more people in that group had a higher probability of receiving treatment (makes sense!)
✌️ More people received the treatment vs control
7/
☝️ More mass on the *right* in the treatment group (top) means that more people in that group had a higher probability of receiving treatment (makes sense!)
✌️ More people received the treatment vs control
7/

Ultimately, to make an apples to apples comparison, we want to make these two groups comparable. There are lots of ways to do this! That is where the *estimand* of interest comes in.
8/
8/
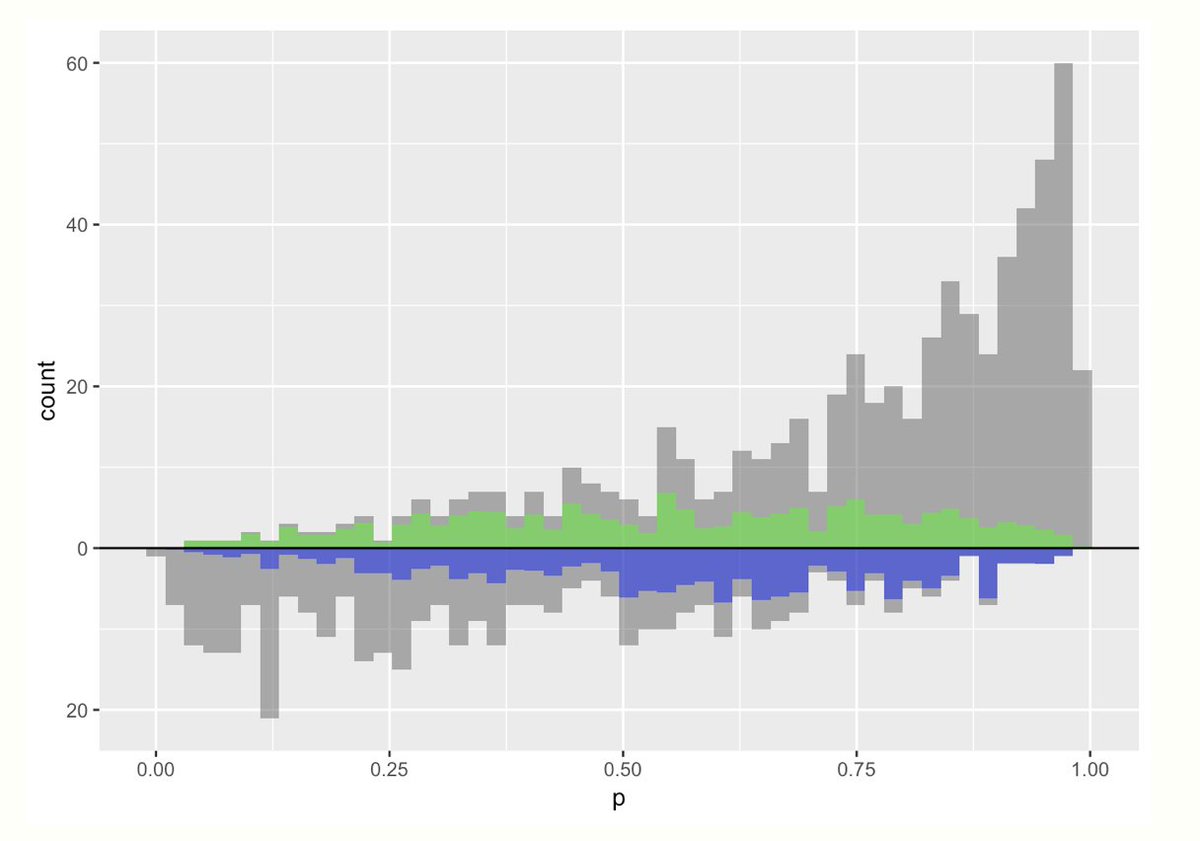
We could estimate the *average treatment effect*. Here the target population is the *whole* population. To make these populations comparable I could *upweight* everyone based on their propensity score.
This graph overlays the pseudo-population created by doing this
This graph overlays the pseudo-population created by doing this

Here, the light green distribution (the up-weighted treatment group) is pretty comparable to the blue distribution (the up-weighted control group). The weights are:
💊 treatment: 1 / propensity score
💨 control: 1 / (1 - propensity score)
10/
💊 treatment: 1 / propensity score
💨 control: 1 / (1 - propensity score)
10/
Notice those weights can range from 1 to infinity! Yikes! If someone in the treatment group has a really small propensity score (or control has a really large one) they could count a whole lot in our analysis. This can lead to finite sample bias // variance issues (boo!)
11/
11/

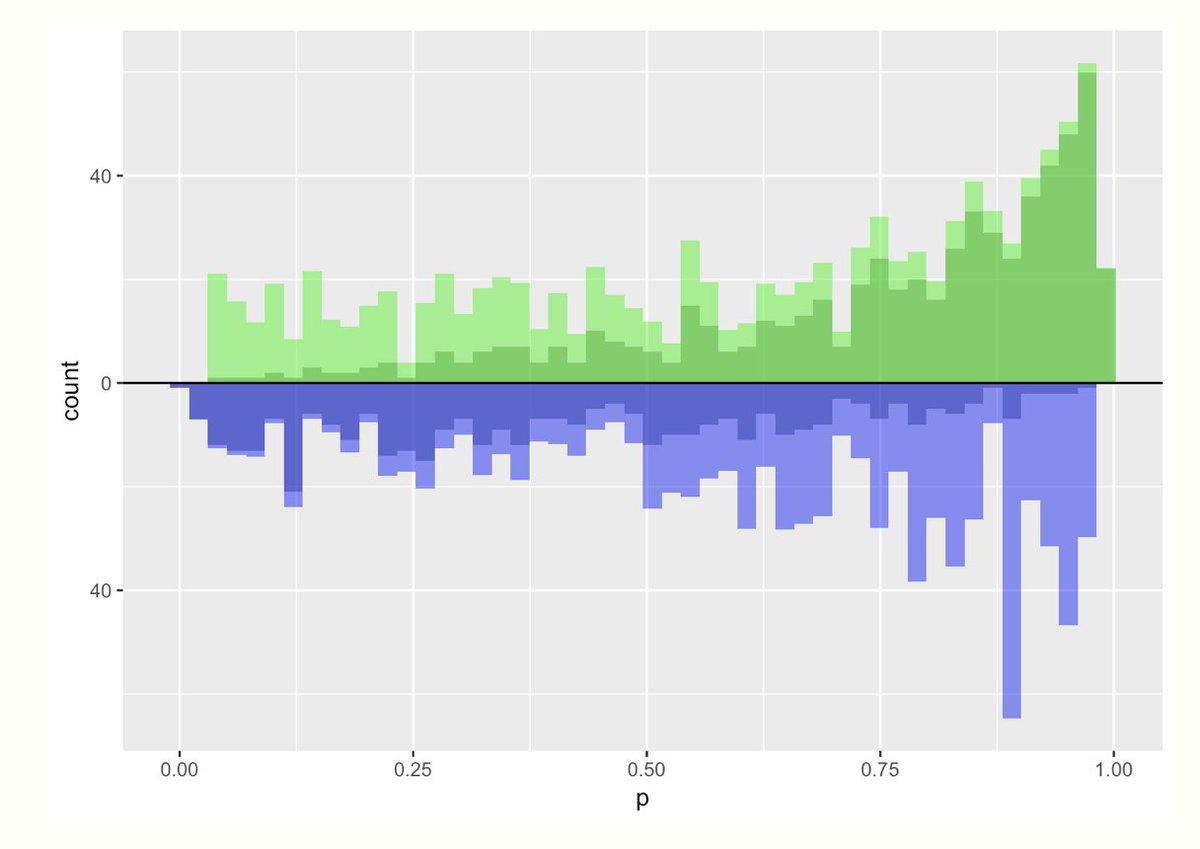
Another estimand is the average treatment effect among the *treated*
💊 everyone in the treatment group gets a weight of 1
💨 control: propensity score / (1 - propensity score)
Notice the blue and green distribution still match! But they look different from the ATE graphs
12/
💊 everyone in the treatment group gets a weight of 1
💨 control: propensity score / (1 - propensity score)
Notice the blue and green distribution still match! But they look different from the ATE graphs
12/

Because this particular example has more treated folks than control, we ended up having to upweight a bunch of the control arm to match -- again this can be unstable
13/
13/
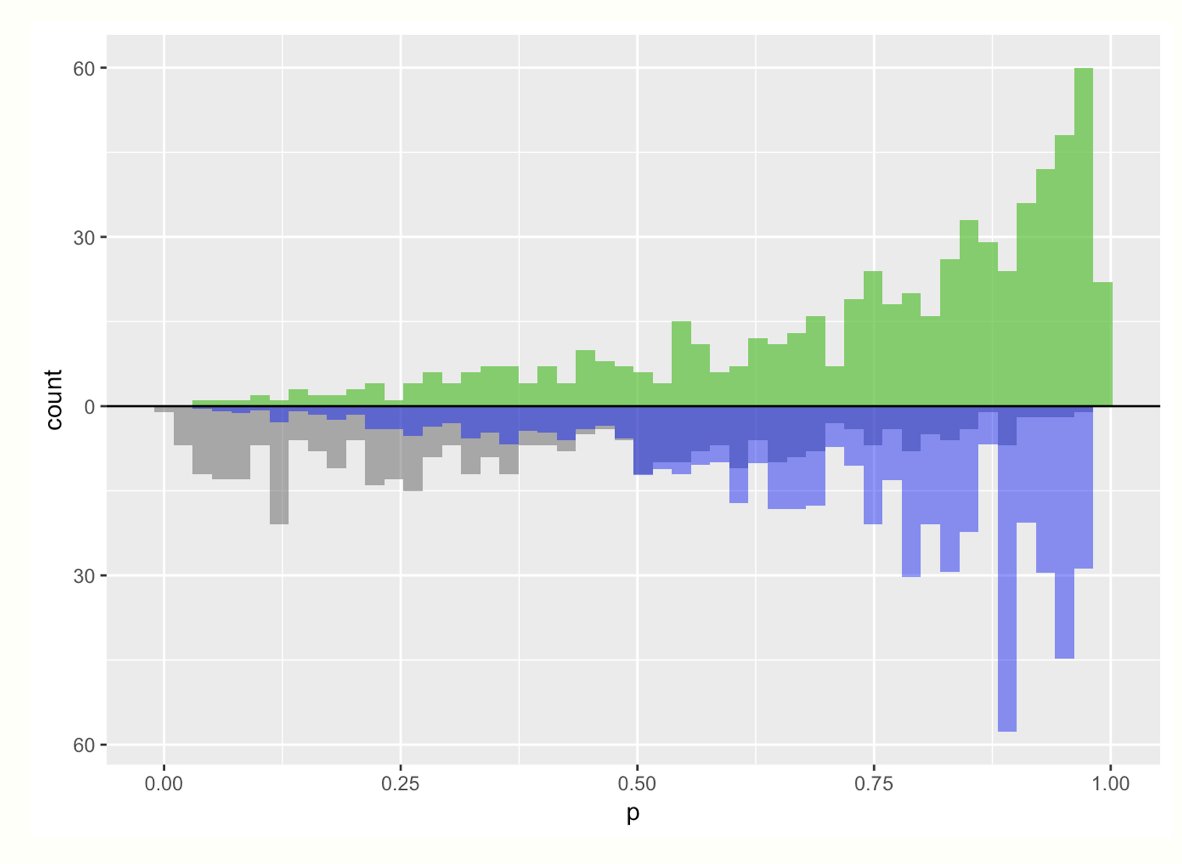
One of my *favorite* estimands is the average treatment effect among the overlap population. The weight is quite simple:
💊 treated: (1 - propensity score)
💨 control: propensity score
These weights are bounded by 0 and 1, so they have nice variance properties!
💊 treated: (1 - propensity score)
💨 control: propensity score
These weights are bounded by 0 and 1, so they have nice variance properties!
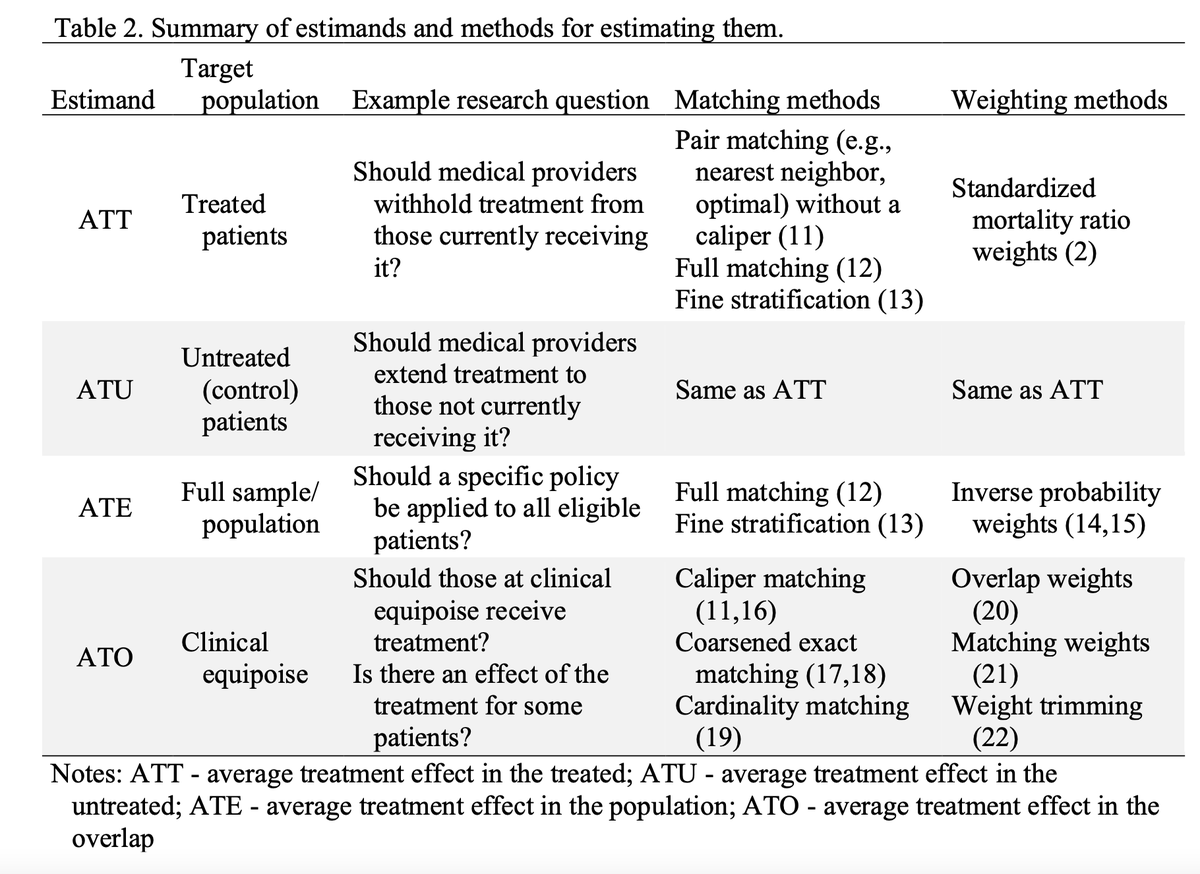
Check out this amazing preprint by @noah_greifer & @Lizstuartdc on how to choose an estimand based on your question (and how that maps to particular weighting / matching choices)
arxiv.org/pdf/2106.10577…
arxiv.org/pdf/2106.10577…
For an #rstats code walk through on the plots I used for this thread, check out this blog post:
✍️ livefreeordichotomize.com/2019/01/17/und…
✍️ livefreeordichotomize.com/2019/01/17/und…
https://twitter.com/WomenInStat/status/1449068312873287682?s=20
• • •
Missing some Tweet in this thread? You can try to
force a refresh


