Here a little meta recap on why #copper is in a super-cycle & why I am bullish short-, mid- & long-term Dr Copper!
Let me start with a shocker: in the very short term we may well run out of Cu inventory. How about that? A week ago I tweeted the below...
Let me start with a shocker: in the very short term we may well run out of Cu inventory. How about that? A week ago I tweeted the below...
https://twitter.com/BurggrabenH/status/1448726290572398596?s=20
A week later and we are at 167,250 tonnes of LME inventory on warrants cancelled for London. Again, cancelled = taken out of inventory. Note however that LME only has 242,610 tonnes of inventory. If this continues, London may run out of inventory this year! That is super bullish. 

I explained that here for all metal exchange inventories combined (London; New York; Shanghai).
https://twitter.com/BurggrabenH/status/1448401343803183111?s=20
Another s-t measure of tighness are smelter Treatment Charges of Cu concentrate in China. They are historically low - a way of saying: "deliver me the copper even at at production loss for us bc by the time I sell it, prices will have gone up enough."
https://twitter.com/BurggrabenH/status/1448399018191642627?s=20
The relative price action of Cu scrap (99% pure, blue line) vs refined copper (white line) in China (which consumes >50% of copper concentrate) also allows to assess short term strength or weakness. Answer: scrap appreciated faster than refined Cu - bullish!

There is more. Copper trades at massive backwardation (cash contract higher than forward contracts) - which in commodities land is a "bullish term structure" - an incentive to sell at spot now to avoid inventory holding cost later.
https://twitter.com/BurggrabenH/status/1448393177283579906?s=20
Obviously, the "elefant in the room" is the China development slowdown? Will it affect overall Cu demand? Answer: likely no. We argue green demand (grid, wind, solar, EVs) will over-compensate much lower construction demand. Message: don't expect China to use less.

In the past, we explained Cu's price correlation with AUD (as proxy for China's thirst for comdies). Note that Cu broke higher of its 10y correlation, likely significantly higher as an expression of its structural supply deficit for years to come.
https://twitter.com/BurggrabenH/status/1398098074493456385?s=20
What about its demand? Super-cycles are demand driven. Well, to comply with climate targets, the world will have to electrify transport, reduce emissions at electricty generation or industrly level & make buildings "#fitfor55". All of it will need much more copper. How much?

Pls, @Bob_McNally believe in green change. It is compliance-driven! Take the car industry where BEVs (Battery Electric Vehicles) have officially become the core strategy for all relevant OEM as the only way to comply with regulatory emission standards from EU to China.

In other words, metal demand such as #copper is turbo-charged and compliance-driven!

Meanwhile, the mining industry struggles to find new resource or bring existing reserves on-line which sets the scene for a structural deficit for years, if not decades, to come!
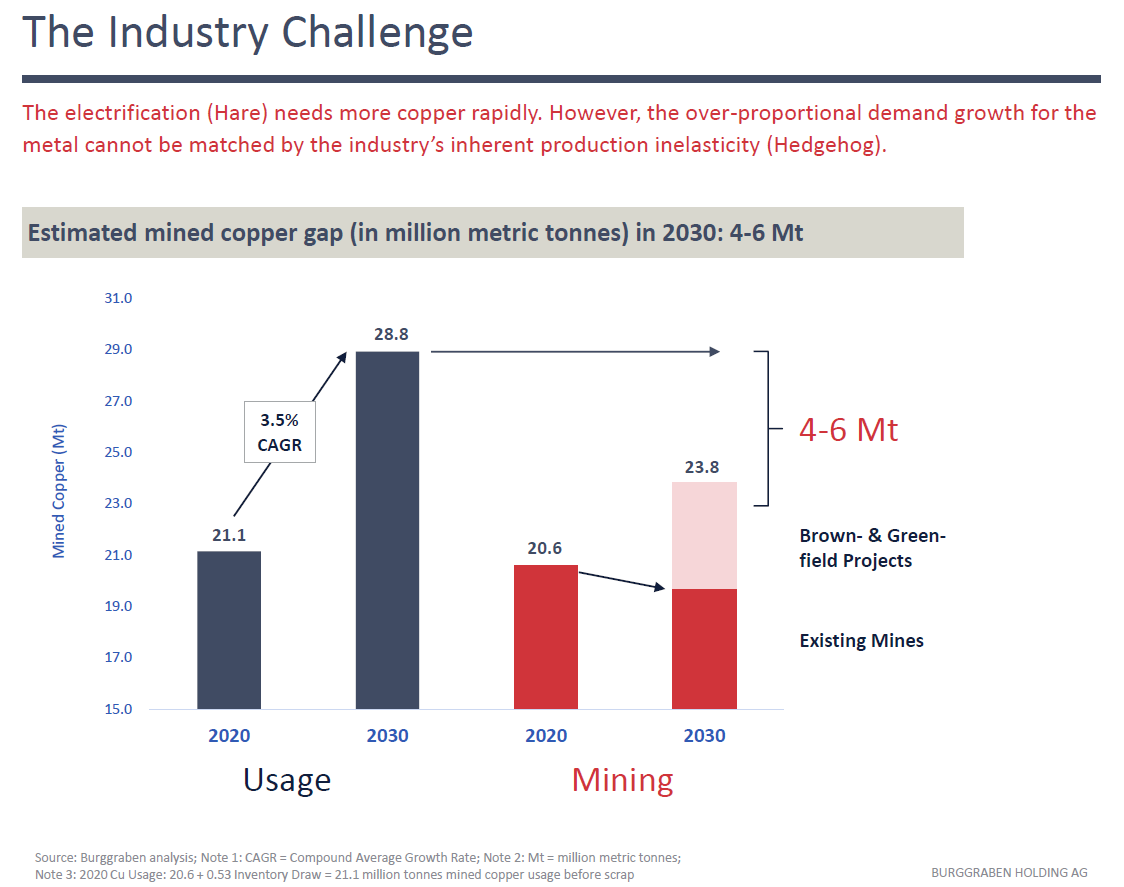
We at Burggraben modelled out EVERY SINGLE copper mine & future mine project out there (>600) to verify the supply challenge & NOT rely on often shallow consulting work (from CRU or S&P). Our verdict: there is no way mines will deliver the copper the industry requires.

Take Coldelco, the Saudi Arabia of Cu. It has too much debt, is capital starved (state-company with mandatory dividends, etc) & needs to replace 74% of its production just to stay still. We spoke to countless insiders & tell you with 100% certainty - it will not happen.

Meanwhile, the cost curve is going higher every day, due to lower grades, higher cost, more regulation (e.g. water management in Chile) or new taxes. The list is endless. Expect the marginal copper pound to come at cost > $6/lb by 2023.

Chile & Peru (45% of Cu supply) alone will make sure our pretictions on cost come true. We discussed their left wing Government developments (e.g. higher royalties) in countless tweets such as the below...
https://twitter.com/BurggrabenH/status/1421018690368286723?s=20
https://twitter.com/BurggrabenH/status/1391172335294730241?s=20
Here is something I like to explain to our clients when they ask "how higher copper prices can go"? Copper is NOT oil. Higher prices won't hurt the consumer. My guess is that prices will overshoot by 2024 & will be > $10/lb. There will be a time of panic without a doubt.

As the mining industry won't deliver the project required to supply the market, prices will go high enough to distruct demand. But remember, copper has a wide moat. It cannot easily be replaced with aluminium (which is an inferior conductor...)

So embrace substitution because with the current Cu-Al ratio being back at a very low 3.2x, I am not very optimistic about new offshore wind projects wanting to risk experimenting with the inferior properties of aluminium to wire-up to the grid at subsea levels.

But they will have to because if we were to use as much copper as in the EU for offshore wind projects (which is where the US & China are heading), then we do not have the copper required only because of offshore wind alone!

Meanwhile, aluminium compares dismal at level of "embodied energy" against copper. Aluminium, in essence, is energy. But isn't the entire green change about using less fossil energy, not more? Well, I guess it can be fixed by moving all aluminium production to SWE or CH (hydro).

However, it is possible that copper will replace silver in solar production. You get my point by now!

End of thread.
Thx for reading & pls feel free to reach out on DM or email alexander.stahel@burggraben.ch
Txh for sharing.
Thx for reading & pls feel free to reach out on DM or email alexander.stahel@burggraben.ch
Txh for sharing.
• • •
Missing some Tweet in this thread? You can try to
force a refresh