1/ Investor Demand for Leverage: Evidence from Equity Closed-End Funds (Dam, Davies, Moon)
"We document a strong negative relation between equity CEF fund leverage and associated discounts, indicating that investors pay a relative premium for leverage."
papers.ssrn.com/sol3/papers.cf…
"We document a strong negative relation between equity CEF fund leverage and associated discounts, indicating that investors pay a relative premium for leverage."
papers.ssrn.com/sol3/papers.cf…

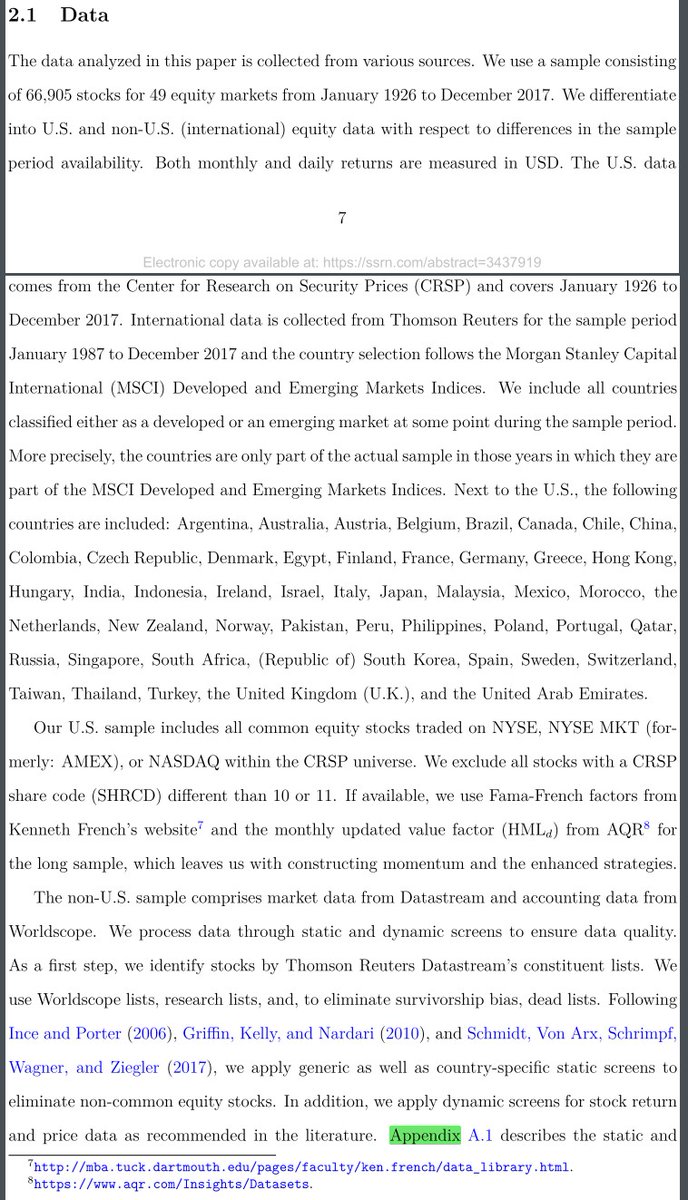
2/ "Each year, we segment funds into two categories: pure equity and mixed-allocation funds. These categories are primarily based on Bloomberg classifications. We manually classify the funds that Bloomberg does not cover. The vast majority of our funds are purely equity-focused."


3/ "To prevent survivorship bias, we do not require funds to have the data from Bloomberg.
"When we use a binary indicator for whether a fund is levered, we set it to zero for funds not covered by Bloomberg. This is conservative (biasing in the direction of finding no result)."
"When we use a binary indicator for whether a fund is levered, we set it to zero for funds not covered by Bloomberg. This is conservative (biasing in the direction of finding no result)."


4/ Discount = 1 - (share price)/NAV
"Compared to unlevered CEFs, levered CEFs have smaller average discounts, have smaller market betas, less HML and SMB exposure, and have lower return volatilities and higher Sharpe ratios.
"Compared to unlevered CEFs, levered CEFs have smaller average discounts, have smaller market betas, less HML and SMB exposure, and have lower return volatilities and higher Sharpe ratios.
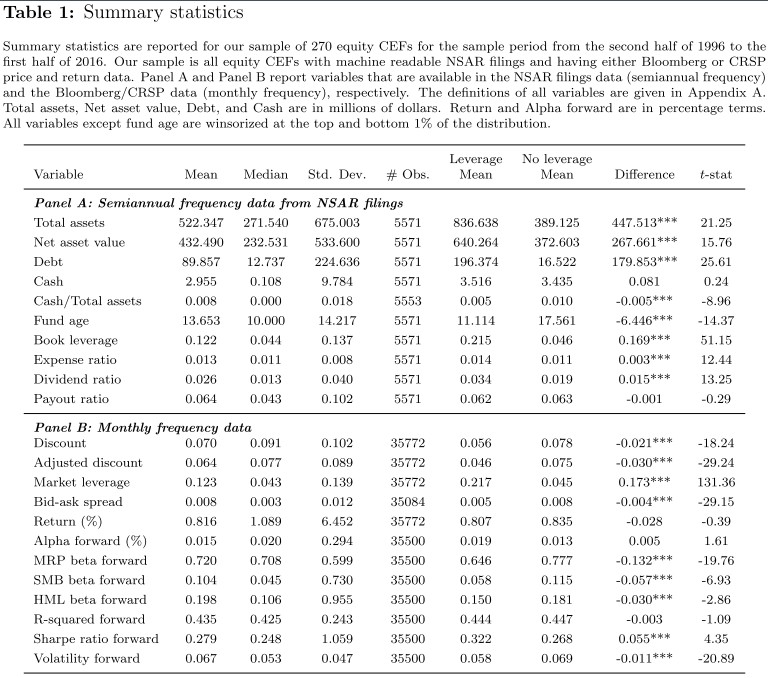
5/ "This indicates that levered CEFs are not simply scaled-up versions of unlevered CEFs.
"Special attention is therefore needed in the analysis to control for these fundamental differences. It also suggests that the most informative regressions include fund-fixed effects."
"Special attention is therefore needed in the analysis to control for these fundamental differences. It also suggests that the most informative regressions include fund-fixed effects."


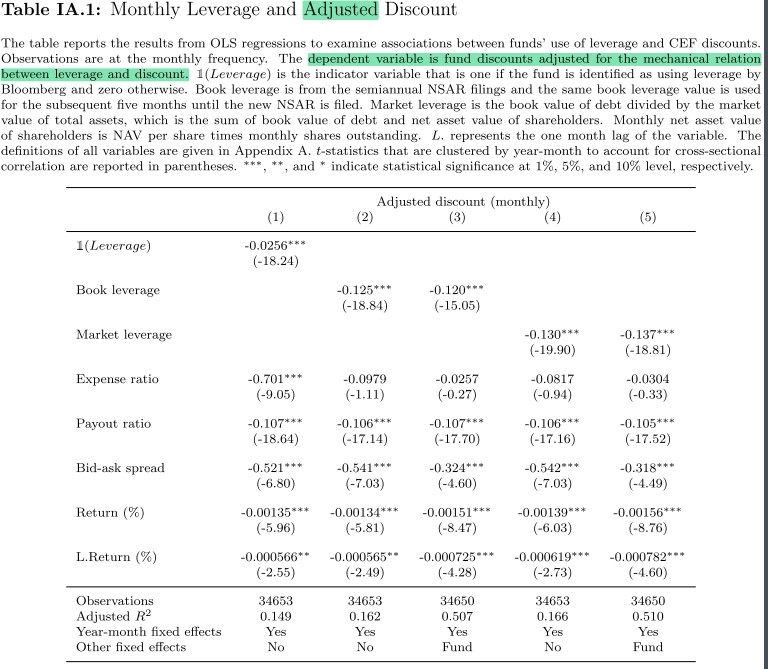
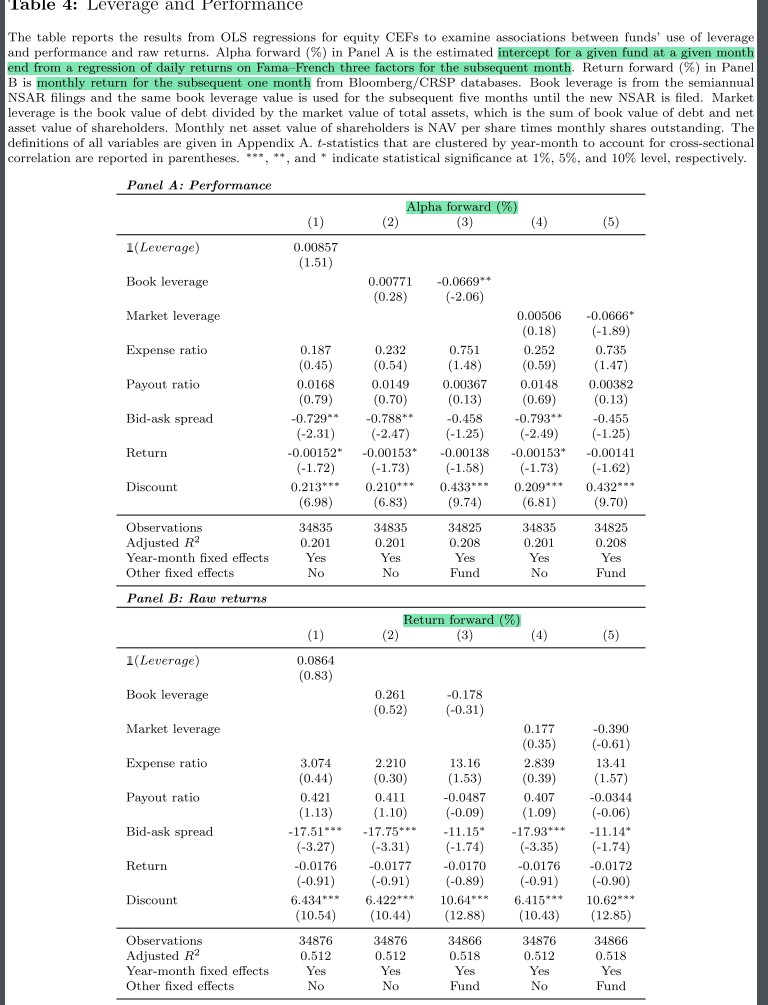
6/ "Fund leverage, both the designation of being a leverage user and variation in leverage levels themselves, are associated with greater investor demand as measured by smaller fund discounts. This demand for leverage does not just hold across funds but also within funds."


7/ "Funds with higher payout ratios, with more liquid shares (as measured by bid-ask spread), and which done well in the current and prior months also trade at smaller discounts. These results are largely consistent with intuition."
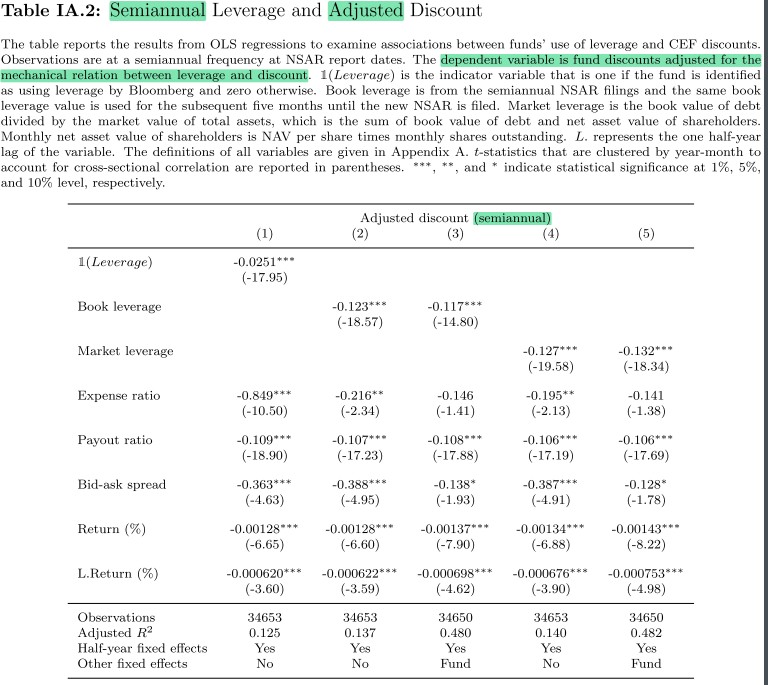
8/ "Table IA.1 and IA.2 replicates the analysis from Tables 2 and 3 but with the adjusted CEF discount suggested by Cherkes et al. (2008). The results are qualitatively the same, both in economic magnitude and statistical significance."
9/ "Given the persistence in CEF discounts shown in Tables IA.3 and IA.4, coefficients on our leverage measures are attenuated but remain economically meaningful and statistically significant."


10/ "We find no evidence for a relation between Ln(Total Fund Assets) and CEF discounts and a slightly negative relation between Ln(Debt) and CEF discounts. These results are consistent with the evidence that investors pay a relative premium for CEF leverage.

11/ "As many studies use CEF data from Morningstar rather than from CRSP or Bloomberg, we manually match our funds to those that are also in Morningstar. Results are essentially identical using this subset of funds."

12/ "Within a fund, increases in leverage are associated w/ inferior subsequent performance.
"Changes in leverage do not signal beneficial changes to funds' new opportunity sets.
"Results are robust to longer (2- or 3-month forward) horizons."
Note: Shapes are monthly Sharpes.
"Changes in leverage do not signal beneficial changes to funds' new opportunity sets.
"Results are robust to longer (2- or 3-month forward) horizons."
Note: Shapes are monthly Sharpes.


13/ "Results that do not include fund-fixed effects are more likely to reflect categorical differences across funds.
"_Within_ a fund, leverage increases have no effect on Sharpes but forecast increased volatility (consistent with CEFs simply scaling up existing strategies)."
"_Within_ a fund, leverage increases have no effect on Sharpes but forecast increased volatility (consistent with CEFs simply scaling up existing strategies)."


14/ "Columns that do not include fund-fixed effects highlight distinct differences in the portfolios of levered and unlevered CEFs.
"Results are consistent with funds using new leverage to scale up as opposed to seeking out new opportunities orthogonal to the existing strategy."
"Results are consistent with funds using new leverage to scale up as opposed to seeking out new opportunities orthogonal to the existing strategy."

15/ "Across funds, levered CEFs take on more idiosyncratic risk vs. unlevered funds. However, within a fund, increases in leverage are not associated with material changes in idiosyncratic risk-taking, again consistent with funds using leverage to scale up existing strategies."

16/ "After controlling for volatility _across_ funds, there is even greater demand for levered CEFs. In contrast, results w/ fund-fixed effects are weaker.
"This suggests investor demand for amplified exposure (whether it comes through explicit leverage or portfolio leverage)."
"This suggests investor demand for amplified exposure (whether it comes through explicit leverage or portfolio leverage)."


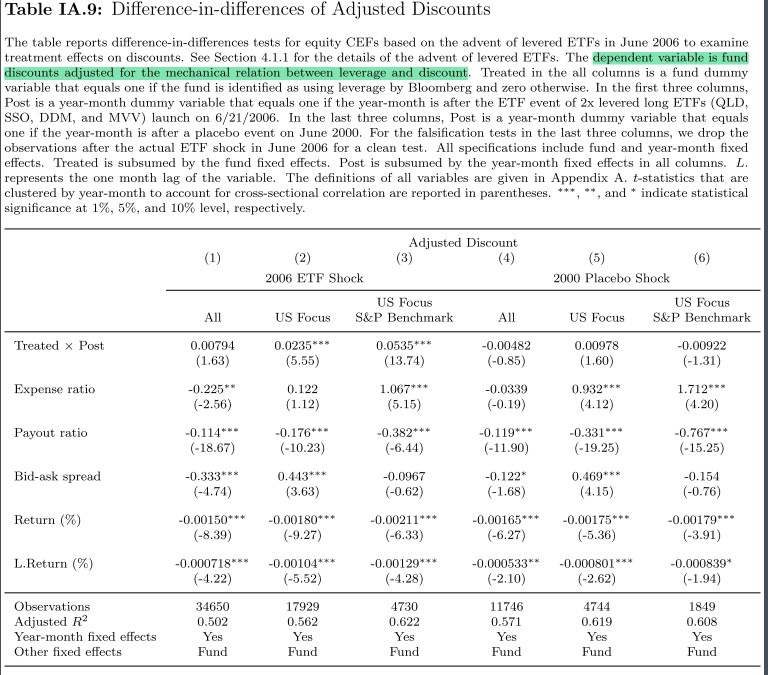
17/ "We argue that the launch of levered ETFs provided a shock to investors demand for levered CEFs. Fees on the ProShare funds launched in summer 2006 ranged from 0.89%-0.95%, while the average and median fees on levered equity CEFs were 1.30% and 1.10%."

18/ "Levered CEFs saw an economically significant drop in the benet of leverage to their valuations once competition for investor leverage access arrived. The effect was strongest for levered CEFs that were most similar to the newly introduced levered ETFs."


19/ "A 1 SD decline in LCEFD predicts a 1.04% increase in the BAB factor the following month.
"After the introduction of leveraged ETFs, investors may have substituted some demand away from CEFs and that levered CEF discounts became a noisier proxy for the market-wide demand."
"After the introduction of leveraged ETFs, investors may have substituted some demand away from CEFs and that levered CEF discounts became a noisier proxy for the market-wide demand."

21/ "We also construct the aggregate unlevered CEF discount (UCEFD). In bivariate predictive regressions, the coefficient on LCEFD (UCEFD) is (not) stat. significant. This suggest that the relation between CEF discounts and BAB relates to leverage as opposed to other drivers."

20/ "Historically, the information in the Baker and Wurgler measure largely reflected changes in more levered funds. This would suggest anyone studying its drivers consider leverage as a key component or a control variable in their work.

21/ "The changes made to the index in 2011 may not be innocuous, as the CEFD pre- and post-2011 may be measuring considerably different dimensions of sentiment. Therefore, the results of any study using the measure across the sub-periods may be affected by the change itself."

22/ Related reading:
The Closed-End Funds Puzzle: A Survey Review
Dividend policy, signaling, and discounts on closed-end funds
Betting Against Correlation: Testing Theories of the Low-Risk Effect
The Closed-End Funds Puzzle: A Survey Review
https://twitter.com/ReformedTrader/status/1377090501883596802
Dividend policy, signaling, and discounts on closed-end funds
https://twitter.com/ReformedTrader/status/1373800895599681539
Betting Against Correlation: Testing Theories of the Low-Risk Effect
https://twitter.com/ReformedTrader/status/1128329691478151170
• • •
Missing some Tweet in this thread? You can try to
force a refresh