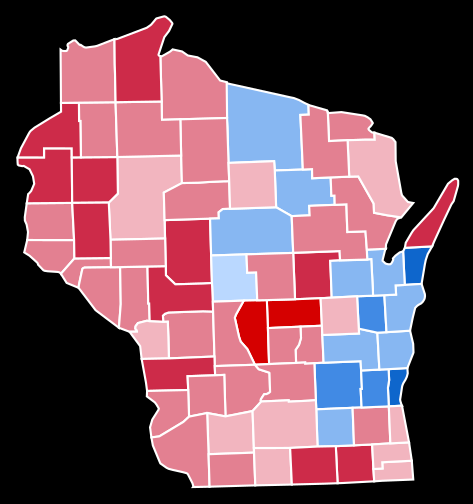
#ElectionTwitter Here's how Dwight Eisenhower performed w/ various demographics in 1952 (1/2):
Whites - 57%
Blacks - 33%
College educated - 66%
High School educated - 55%
Grade School educated - 48%
Professional & Business - 64%
White Collar - 60%
Manual worker - 45%
Farmer - 66%
Whites - 57%
Blacks - 33%
College educated - 66%
High School educated - 55%
Grade School educated - 48%
Professional & Business - 64%
White Collar - 60%
Manual worker - 45%
Farmer - 66%
1952 GOP vote (2/2):
Protestant - 63%
Catholic - 44%
Republican - 92%
Independent - 65%
Democrat - 33%
East - 55%
Midwest - 58%
West - 58%
South - 49%
Protestant - 63%
Catholic - 44%
Republican - 92%
Independent - 65%
Democrat - 33%
East - 55%
Midwest - 58%
West - 58%
South - 49%
It appears that I made a mistake with one of the figures. Eisenhower only won 23% of Blacks, not 33%
• • •
Missing some Tweet in this thread? You can try to
force a refresh


