
Excess savings for many households is likely to be gone before the end of the year. 
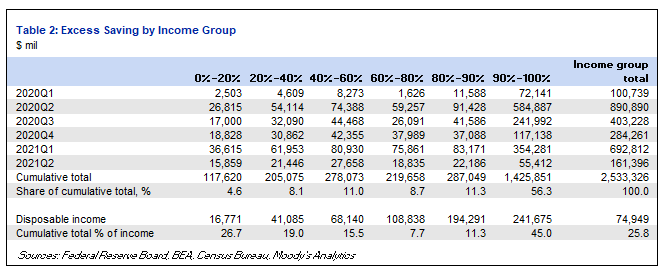
As of September, households with incomes in the 20%-60% range of the income distribution have an estimated nearly $500 billion in excess savings.
This excess savings amounts to about $10,000 per person in this income group but expenses are close to $4,000 per month.
The financial pressure to return to work is thus quickly intensifying.
To calculate excess personal saving during the pandemic by income group, we first calculate the amount of savings by income group based on the change in the value of assets owned and liabilities owed by income group.
The source for the value of the assets and liabilities is the Financial Accounts, and the source for the share of assets owned and liabilities owed by income group is the Survey of Consumer Finance.
We linearly interpolate the SCF shares between SCF survey periods, and extend the last available SCF share to be consistent with the last available data from the Financial Accounts data.
We distribute BEA-measured savings to income group using the share of savings by income group derived using the Financial Accounts and SCF.
Excess personal savings is the difference between savings by income group since the pandemic began in 2020q1 and their savings in 2019 prior to the pandemic.
• • •
Missing some Tweet in this thread? You can try to
force a refresh


