
A MEGA THREAD ON 📕
RETEST TRADING !
DO EVERY STOCK RETEST AFTER BREAKOUT ?WHEN TO TAKE AN ENTRY ?
WHICH IS BETTER ?
RETWEET AND LIKE ❤
@kuttrapali26
@rohanshah619
@Mr_Chartist @AmitabhJha3
RETEST TRADING !
DO EVERY STOCK RETEST AFTER BREAKOUT ?WHEN TO TAKE AN ENTRY ?
WHICH IS BETTER ?
RETWEET AND LIKE ❤
@kuttrapali26
@rohanshah619
@Mr_Chartist @AmitabhJha3
2/
What is RETEST ?
When a stock Breaks out of a range that is called a breakout point .
The resistance that it was facing should now act as support .
Retest means after the Resistance is broken the stock comes back to take support in that region
What is RETEST ?
When a stock Breaks out of a range that is called a breakout point .
The resistance that it was facing should now act as support .
Retest means after the Resistance is broken the stock comes back to take support in that region

3/
MAJORITY of time stock comes back to test the previous breakout region .
I have seen that 90% of The breakouts gets tested again !
And most REWARDING EXPERIENCE for me is during Retests only
MAJORITY of time stock comes back to test the previous breakout region .
I have seen that 90% of The breakouts gets tested again !
And most REWARDING EXPERIENCE for me is during Retests only
4/
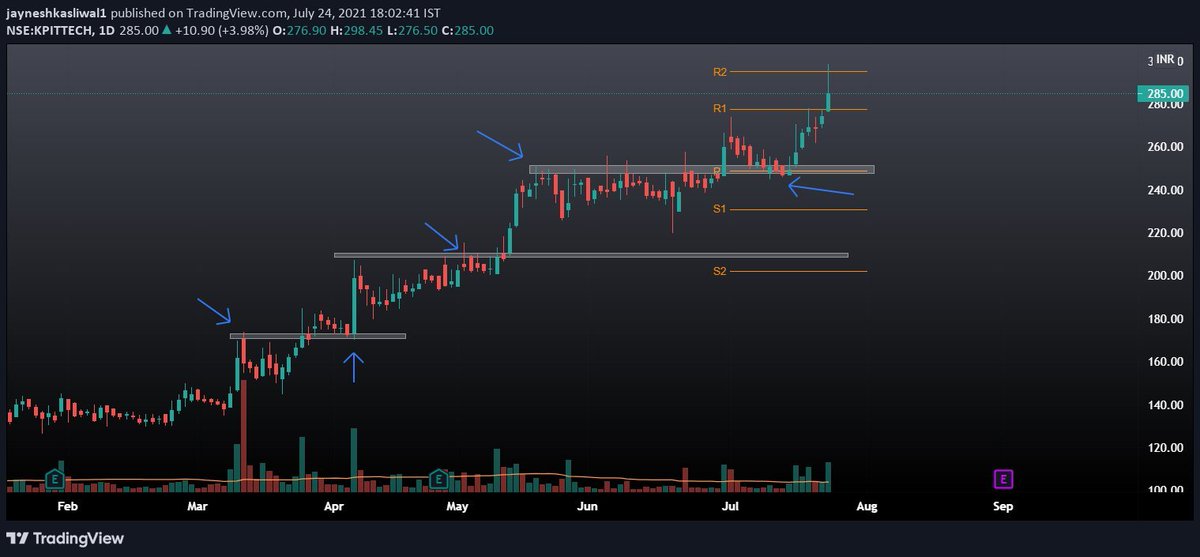
LETS ANALYSE #KPITTECH CHART
1. Stock has broken out of range and rallied quickly in momentum.
2. The best place to enter in breakout stocks is not at the top where most retailers get trapped but again at retest.
3. In this case the retest that happend was after 50 days
LETS ANALYSE #KPITTECH CHART
1. Stock has broken out of range and rallied quickly in momentum.
2. The best place to enter in breakout stocks is not at the top where most retailers get trapped but again at retest.
3. In this case the retest that happend was after 50 days

5/
4.There is no fixed rule that stock will come to retest immediately after breakout .
5. It can be after days , months or even years before it retests the prev breakout region .
6. Here the #KPITTECH retested immediately in 4 to 5 days.
4.There is no fixed rule that stock will come to retest immediately after breakout .
5. It can be after days , months or even years before it retests the prev breakout region .
6. Here the #KPITTECH retested immediately in 4 to 5 days.


6/
7. Here the stock has been respecting the breakout region and not breaking down.
8. This explains the strength of buyers in that stock unlike #VGUARD
Where the support is broken ⚠️
7. Here the stock has been respecting the breakout region and not breaking down.
8. This explains the strength of buyers in that stock unlike #VGUARD
Where the support is broken ⚠️

7/
Sometimes the breakout is retested after years
#TATACONSUMER
Retesting after 518 days or sometimes it can be just touch and go like #TATAELXSI
Sometimes the breakout is retested after years
#TATACONSUMER
Retesting after 518 days or sometimes it can be just touch and go like #TATAELXSI


8/
BREAKOUT NOT RETESTED
Sometimes the stock does not retest its breakout region but that happens very rarely
#LAURAS #BALAJIAMINE
BUT THAT HAPPEND ONLY ONCE
After everybreakout there was a retest .
This can be ignored and moved on
BREAKOUT NOT RETESTED
Sometimes the stock does not retest its breakout region but that happens very rarely
#LAURAS #BALAJIAMINE
BUT THAT HAPPEND ONLY ONCE
After everybreakout there was a retest .
This can be ignored and moved on


The best Risk Reward you find is AT the exact breakout point or retest point.
Anything in between is just a higher risk and you will observe that generally whenever you buy breakouts the price comes down at the end of day .
Anything in between is just a higher risk and you will observe that generally whenever you buy breakouts the price comes down at the end of day .
• • •
Missing some Tweet in this thread? You can try to
force a refresh


