
1/ 🚨🚨 cdc.gov/mmwr/volumes/7… This MMWR article is a confluence of methodological flaws, that amplify to serve the predetermined message of the CDC. This 🧵 will summarize my appraisals.
2a/ On a high-level, they utilize “adjusted” odds ratios to dramatize the result. The ACTUAL raw difference between PI and Vax is actually small: 8.7% PI vs. 5.1% Vax in HOSPITALIZED PATIENTS with C19-like symptoms. 3.6%. That is a SMALL difference in a very SPECIFIC population.
2b/ On ABSOLUTE TERMS this is rather small, and can easily created by subtle selection bias. If they could find 53 fewer PI infxns or 228 vax infxms out of 201, 000 eligible patients --- the ORs would “break even”.
2c/ Weirdly, authors define pop based on a hospitalization endpoint, and search bckwrds for PI vs. Vax. This is peculiar, because most other studies identify PI and Vax first, and then look forward for outcome (“longitudinal” observation). This is suspicious.
3a/ DEFINITIONS: Exposure groups are narrowly constrained. First, limited to HOSP pts only, a very small subset of sickest C19. Both PI and Vax protect against hospitalization, EXCLUDING MOST PEOPLE.
3b/Definition of exposure groups very constrained. PI group with prior infection btwn 14-90 days prior to hospitalization were excluded – the strongest naturally immune 

3c/ Primary analysis looked at PI or Vax 90-179 days prior (3-6mos) Why? This avoids Pfizer’s WANING tendency after 6 mos. It also biases Vax group to a more elderly population vs PI group. This will be important in "matching" the groups (more later).
4a/EXCLUSIONS: Of 201,000 hospitalized pts with C19-like illness originally identified, only 7,300 met criteria ! Only 1,020 with PI. They excluded so many people, but then derived a conclusion based on only 414 infections! A small shift in inclusions could change entire result.
4b/ Children <18 yo excluded (reasonable), but cannot apply conclusions to children. J&J also excluded, the weakest vax. If J&J was beneficial to their analysis, you KNOW they would have included it.
5a/ Matching and : The above definitions and exclusions creates a highly MISMATCHED PI and vax group. Age, geography, hospitalization period, and time from PI/Vax are all different in both groups!
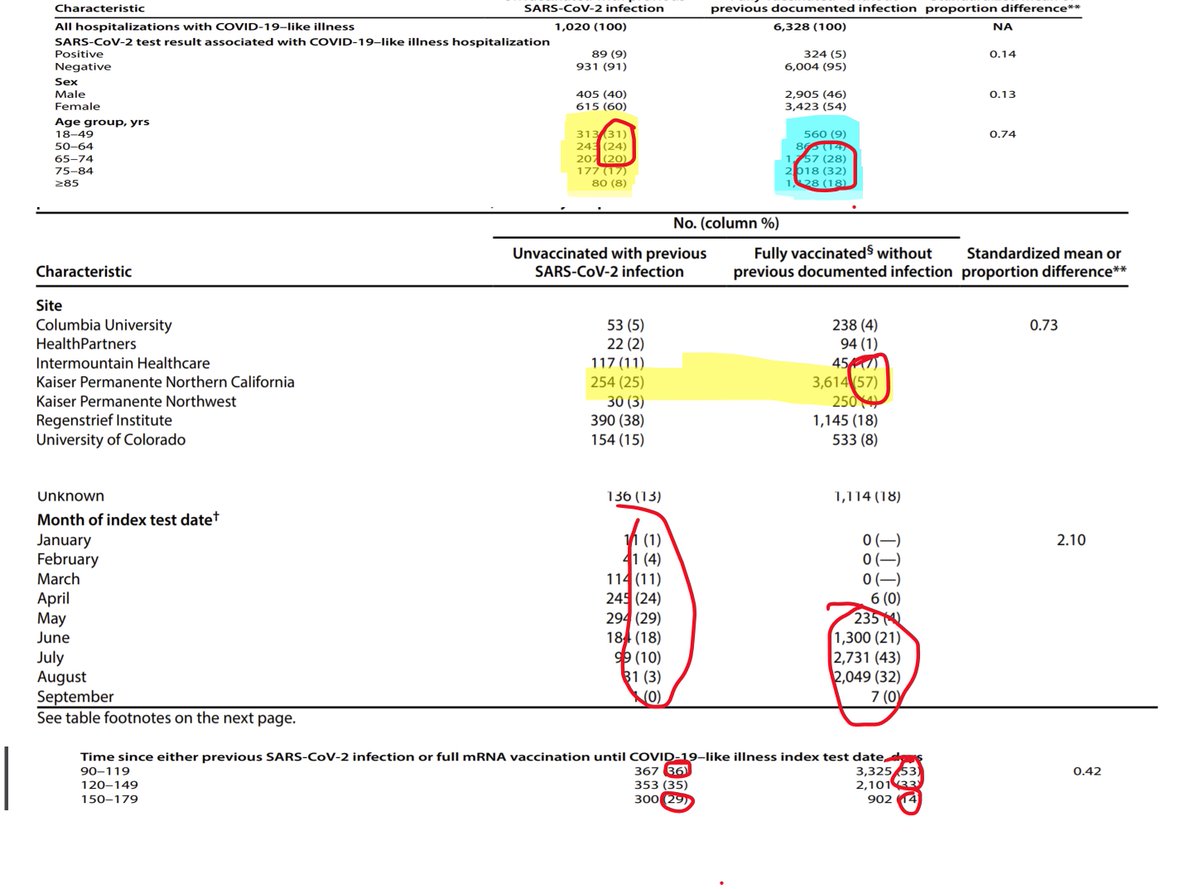
5b/ Age in particular is very mismatched, with PI having a younger bias, and vax having an elderly bias. This stems from using the 90-179 day window, and the elderly were vaxed earlier.
5c/ Because of these mismatches, the authors have to rely heavily on adjustment. However, the data was not robust enough to provide reliable adjustment by authors own description, particularly on age.

6a/ Adjustments: The authors use a “propensity score matching” method to “adjust” for above mismatches. This method is very nuanced, and can lead to wrong conclusions if misapplied. In fact, authors actually concede this too in their limitations (see fig).

6b/ There appears to be a lot of adjustment processes – so much so that little appears to come from SMALL NUMBERS in the actual data, and more comes from the adjusting! Of course, we never see the adjustment metadata, so it is NOT TRANSPARENT.

6c/ Apparently they correct for comorbidities, BUT never publish the differences in comorbidities in each group for reader to dissect. Large differences in comorbidities (as we would now expect) would further mismatch the groups.
6d/ onlinelibrary.wiley.com/doi/full/10.10… If two groups are do not overlap very well, propensity score matching method can lead to erroneous conclusions.

6e/ We never see this complex adjustment model, for which the authors heavily rely on to achieve their top line conclusions. RED FLAG! 🚩🚩
7a/ Other biases: Vaxed people are less likely to get tested, seek medical attention, and/or get admitted. Therefore, Vaxed persons that may be infected, never make it to this analysis. Also, majority of vax comes from 1 center, vs. PI come from 7 centers.
7b/ While they grossly match time from prior infection/vaccination, there does not appear to be a direct time adjustment. Incidences are generally reported in events/person-time. Methodology seems avoid robust time methods.
8a/ Results: The top line result, is that within hospitalized patients, PI/Unvaxxed has a 5.49x odds of infection compared to Fully vaxxed.

8b/The absolute result demonstrates a small difference in attack rate, PI 8.7% vs. Vax 5.1% (in a hospitalized population with COVID-like symptoms). This absolute difference would likely be smaller, if included non-hospitalized patients as well.
8c/ The “odds” for PI is 91.3/8.7=10.5; for vax: 94.9/5.1=18.6. The RAW OR should be 18.6/10.5= 1.77 ; however, they report 5.49 AFTER ADJUSTMENT.
Tripling the ODDS ratio by “adjustment” seems rather EXCESSIVE. This can be explained by an unstable adjustment method.
Tripling the ODDS ratio by “adjustment” seems rather EXCESSIVE. This can be explained by an unstable adjustment method.
8d/ While not as dramatic, other adjusted ORs vary quite a bit from their raw ORs. But persons AGED over >65 had an aOR of ~20x ! Age mismatch likely had a large role in adjustment.
There could be other significant adjustments, but we don't know because its not presented
There could be other significant adjustments, but we don't know because its not presented
8e/ Bottom line on results: While the raw results were based on small numbers within a small SELECTIVE subset, the intensive and hidden ADJUSTMENT processes based on imprecise models likely introduced ERROR.
9A/ OTHER THOUGHTS: Why did they limit analysis to PI/UnVax and Vax/Never Infected only? Based on database, they could have EASILY pulled the UnVax/Never Infected (UV/NI) group for comparison.
9B/ If they presented the UV/NI group, it would show relative differences between PI and Vax group were comparable. By only comparing PI to Vax, it focuses on small differences.
9C/ Authors conclude all pers should get vaxed, including those w/PI. They make this statement WITHOUT presenting data on vaccination effect on previously infected! This is not a scientific conclusion based on their study, but a POLICY statement.
10a/ CONCLUSION: It appears that this study was specifically designed to derive a result favorable to the CDC narrative. The design and methods are peculiar and seem constructed in a deliberate manner different than other studies on the same topic.
10b/ By looking at hospitalized patients only , then applying definitions/time filters/exclusions, created highly mismatched comparison groups. Not all mismatched variables are even presented
10c/ They then relied on an opaque and hidden adjustment process to “correct” for this mismatch, which is never presented, and cannot be directly challenged.
10d/ They focus on the small differences between PI/Unvaxxed and the Never Infected/Vaxed. They neglect presenting the NeverInfected/Unvaxed (when they easily could have) , which would likely show substantially similar protection.
11a/ FINAL THOUGHTS: It is important for a public institution, like the CDC, to provide objective scientific analysis, without any pre-determined conclusions.
11b/ When highly contorted and opaque methods are utilized instead of simple and straightforward longitudinal comparisons, it seems methods were designed to achieve the desired result.
11c/ The study populations seem highly selected, and the adjustments (which we never see) seem much stronger than the raw effect.
11d/ I hope I am wrong. I would respectfully request the @CDCgov and @CDCMMWR to fully publish their dataset, & all adjustment and propensity score models, for PUBLIC review. This is the only way we can reach an honest conclusion. Let's do what is RIGHT, not what is POLITICAL
@CDCgov @CDCMMWR 11e/ As always, thank you for reading. There is always more detail than I can include in a tweet, so apoligize for the technospeak. I am open to comments/ corrections/ concerns.
https://twitter.com/JeanKurthausen/status/1454780902375047171?t=-FlIoOjVmEFfxYWtwtSPTw&s=19@JeanKurthausen brings up another great point. PI has 3 more months of exposure. Another big bias!
• • •
Missing some Tweet in this thread? You can try to
force a refresh


