Lara Putnam Profile picture
Nov 4, 2021 12 tweets 5 min read Read on X
Whoa here is a map we have not seen for a *while*
Guesses?
So, Delco may still have some mail in ballots left to count, & I suppose others might as well? But as of today, at least, this is where the Nov 2021 PA Dem top of ticket (Maria McLaughlin) improved over Joe Biden, and where she lost ground.
Sorry, realized that was ambiguous. Everywhere in blue here saw Maria McLaughlin improve over Joe Biden's vote share. Everywhere in red saw Brobson improve over Donald Trump. [But note Delco mail-in vote count not yet complete: could end up a lighter shade of red...]
Meanwhile, in ballots reported as of today Nov. 4, here's the change of each county's total ballots cast within the statewide total. Bucks & Erie, 👀
All of which is to say, most of this Tuesday's statewide results could be predicted by taking Joe Torsella's narrow Nov 2020 defeat as the baseline for partisan allegiance within PA moving forward...
Update: After spending an obsessive evening with Dept of State data @GianniHillPA helpfully pointed me to, it looks like there are at least ~69,000 timely mail-in ballots statewide not yet tallied, concentrated in Philly & Montco but spread widely, & ranging fr 60-85% Dem. So!
@GianniHillPA Calculating by county suggests statewide Dem candidates may net 35-45,000 more votes from these mail-ins (range bc possible undervotes, missing signatures etc). #CountEveryVote people, ain't over til it's over. So as not to contribute to a misleading early closure I redid my maps
@GianniHillPA & here's the swing from Trump to Brobson, w/not-yet-tallied mail-ins modeled & added. In blue counties McLaughlin 2021 outperformed Biden 2020, in red vice versa. No, I have no idea what's up w/Mercer (wondered first if Brobson was fr there but no, that's Lycoming: also visible!)
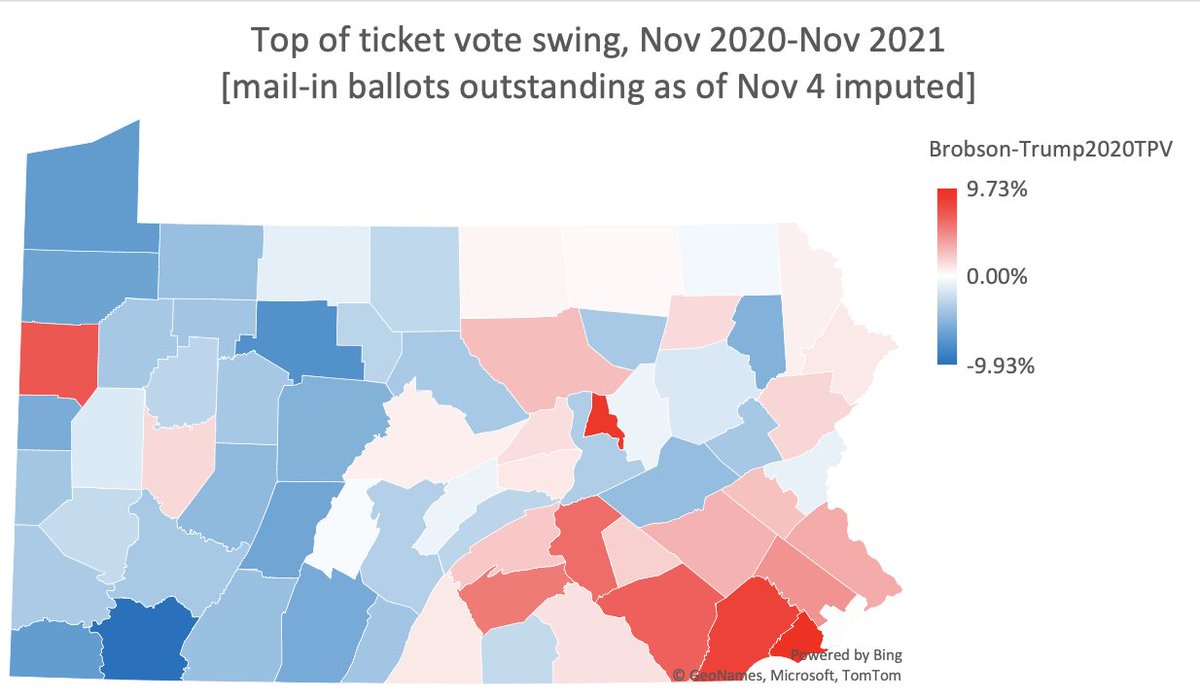
@GianniHillPA And hmm, what if Nov 2021 in PA doesn't look like a grim new omen for PA Dems but more like... 2017?
@GianniHillPA and because I know you were about to ask, here's what relative turnout shifts from previous year's presidential looked like in 2017
(btw please note that whatever comparison you look at, @eriedems just absolutely killed it in 2021. @jim_wertz! )

• • •

Missing some Tweet in this thread? You can try to force a refresh
 

Keep Current with Lara Putnam

Lara Putnam Profile picture

Stay in touch and get notified when new unrolls are available from this author!

Read all threads

This Thread may be Removed Anytime!

PDF

Twitter may remove this content at anytime! Save it as PDF for later use!

Try unrolling a thread yourself!

how to unroll video
  1. Follow @ThreadReaderApp to mention us!

  2. From a Twitter thread mention us with a keyword "unroll"
@threadreaderapp unroll

Practice here first or read more on our help page!

More from @lara_putnam

Sep 4
This🧵is going to be about PA voter registration trends but let me start here. The thing about our beautiful commonwealth is: it's made up of a bunch of different kinds of places whose politics are being pulled in opposite directions. Start w this map, using @AmcommPro categories Image
@AmCommPro Teal=Rural. (Fun fact: PA has the 3rd largest rural pop., in absolute terms, in the whole USA!)
Green="Middle Suburbs." Think Rust Belt: aging ex-industrial.
Orange=Urban suburbs: diverse, dense, educated.
Yellow=exurbs: less dense, less diverse, relatively wealthy.
Pink=Big City Image
@AmCommPro Each of these county-types accounts for a meaningful chunk of population: by 2023 stats, Urban Suburbs are home to 26% of PA's pop; Rural 20% [or ~23% if you add the 2 smaller rural categories to it], MiddleSuburb (=Ex-Industrial) 18%, Exurbs 17%, Big City (=Philadelphia) 12% Image
Read 16 tweets
Nov 9, 2023
to appreciate the scale of Dems' statewide success this wk you have to cast your mind back to the distant past of... Nov 2021, at whch point it looked fully possible the PA electorate would keep speeding rightward twice as fast as it had lurched left after the election of DJTrump
Here's an even clearer metric I ended up with, one that captures turnout shifts as well as vote choice swings: change in net votes by county, averaged across statewide candidates each year to create something close to generic Dem v generic Rep results Image
In Delco, Montco, Philly & Allegheny Dems had hung on to some anti-Trump era gains, but pretty much everywhere else* across the state—most impactfully in Bucks, SCPA, & the big non-Allegheny counties of SWPA--Republicans were ascendant

*ok Dauphin Lackawanna & Monroe broke even Image
Read 12 tweets
Nov 13, 2022
It was certainly plausible to think that John Fetterman would have a uniquely strong performance among white working-class or rural Pennsylvanians but... that didn't turn out to be the case at all?🤷‍♀️
The results are especially striking because surely holding everything equal, one would expect Doug Mastriano's appeal to be strongest in the rural+rust belt areas that swung hard in support of Donald Trump: & Oz to be more appealing in the upscale/moderate/cosmopolitan suburbs?
The darker green counties here are the ones where Shapiro outperformed Fetterman most strongly: which is the same as saying, where Oz outperformed Mastriano most strongly. SCPA/the capitol region, Bucks, but also Cambria, Westmoreland, Butler, Erie🤷‍♀️
Read 14 tweets
Nov 11, 2022
Return of the 2018 Coalition, On Steroids (A Quick Thread on 2022 in Pennsylvania Before this Website Collapses).

tl;dr After Dobbs, the suburbs' anti-Dem realignment screeched to a halt & the anti-Trump realignment returned Image
Lots of things happened around the end of June: Dobbs, bipartisan bills, gas prices coming down, Jan 6 hearings gaining news. The exact proportions of which had an impact on who may remain up for debate. But what's clear is things changed & stayed changed
The geography of voter reg trend shifts was striking: Dems stopped hemorrhaging voters in PA's "Middle Suburb"/once-industrial counties: & went back to posting 2016-18 style gains in PA's upscale/cosmopolitan "Urban Suburb" counties
Read 20 tweets
Nov 9, 2022
This👇is not wrong! But note it's not just a demographic thing. The state & local organizations created/recreated by the anti-Trump grassroots ran through the tape for downballot Dems this year: even while hearing (& believing!) national voices foretelling doom
National voices #onhere have not yet processed what a stunning year this was for downballot Dems in PA. The inverse of 2020, when the presidential result distracted attention from PA Dems' grim downballot slide. PA lived the midterm backlash 2 ys early!💪
.@LetsTurnPABlue @TuesdaysToomey @acttogethernepa etc — plus the groups of different origin & profile who saw their potential & figured out how to partner: @seiuhcpa @NewPennsylvania @UniteforPA & many more
Read 13 tweets
Nov 9, 2022
Because you are all about to realize you need to know this: in 2021 Democratic PA Supreme Court candidate Maria McLaughlin's share of provisional ballots in both Lehigh & Northampton counties was exactly 20 ppt higher than her share of EDay+Mail votes in each.
...& likewise in Montgomery County. fwiw. 👀
... and likewise in Bucks 👀 . 2021 provisionals were 19 ppts more Dem than the combined E-Day and Mail ballots were.
Read 4 tweets

Did Thread Reader help you today?

Support us! We are indie developers!


This site is made by just two indie developers on a laptop doing marketing, support and development! Read more about the story.

Become a Premium Member ($3/month or $30/year) and get exclusive features!

Become Premium

Don't want to be a Premium member but still want to support us?

Make a small donation by buying us coffee ($5) or help with server cost ($10)

Donate via Paypal

Or Donate anonymously using crypto!

Ethereum

0xfe58350B80634f60Fa6Dc149a72b4DFbc17D341E copy

Bitcoin

3ATGMxNzCUFzxpMCHL5sWSt4DVtS8UqXpi copy

Thank you for your support!

Follow Us!

:(