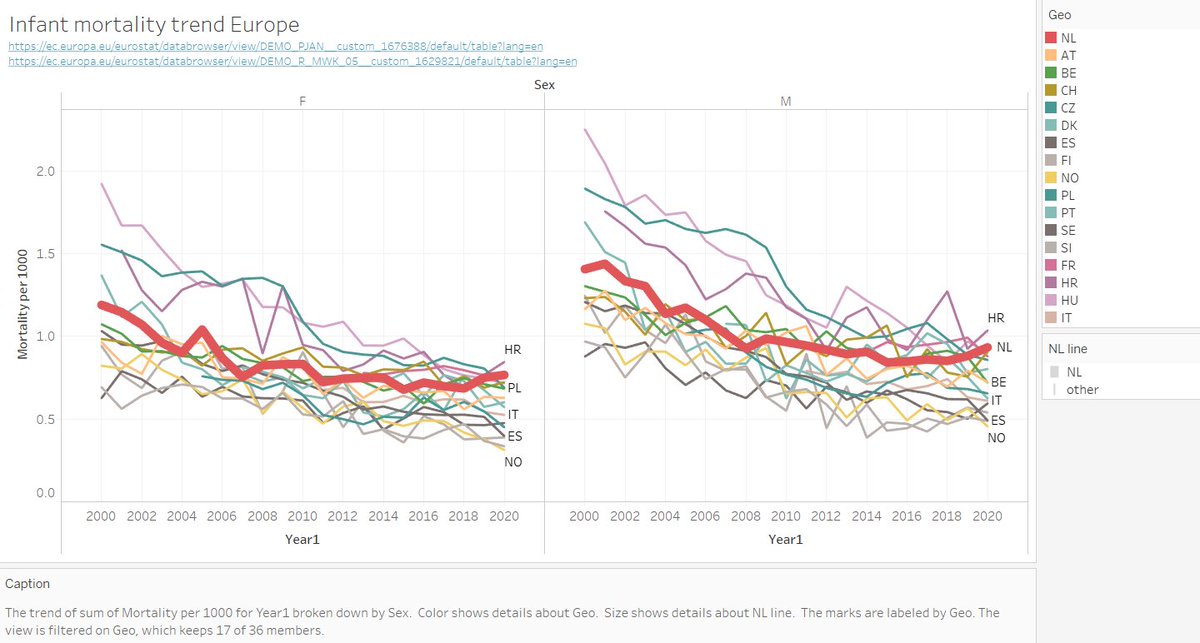
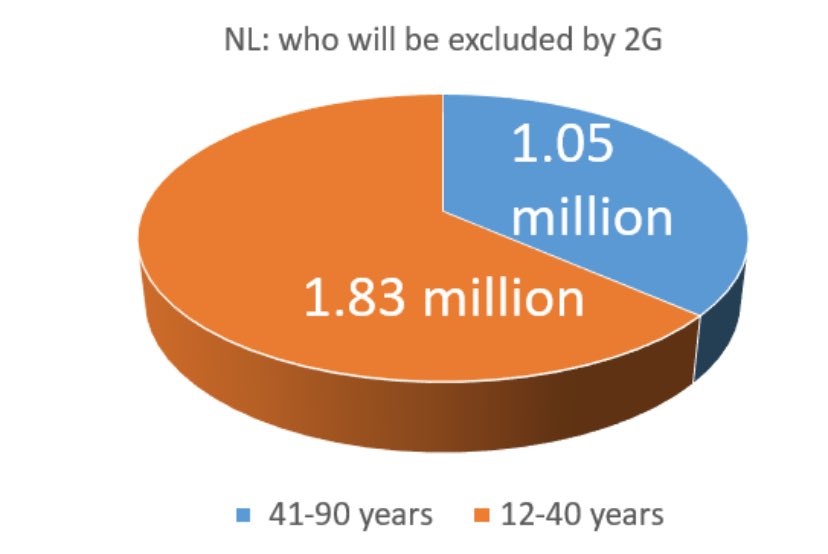
Netherlands 2G : who will be punished and excluded?

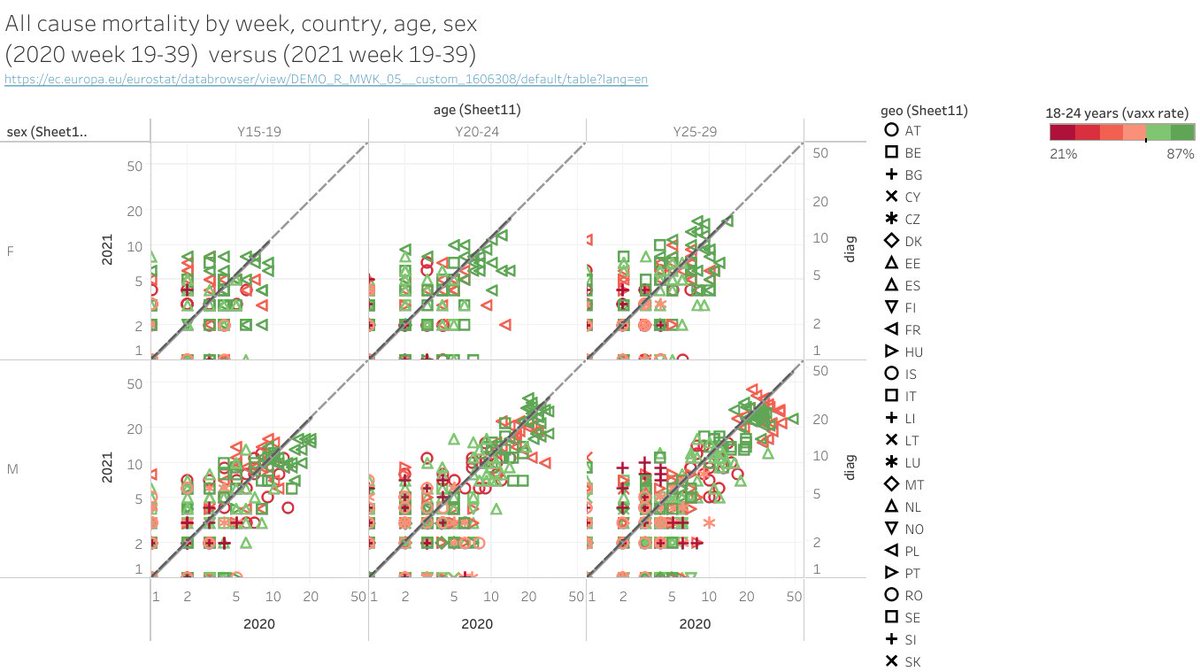
1.8 million 12-40 year olds!!

63% of all imacted are from this group.

Wake up dear future NL generation!!

The vaccinated old, are locking down their own children. Those do NOT end up in ICU (with or without vaccination). Image
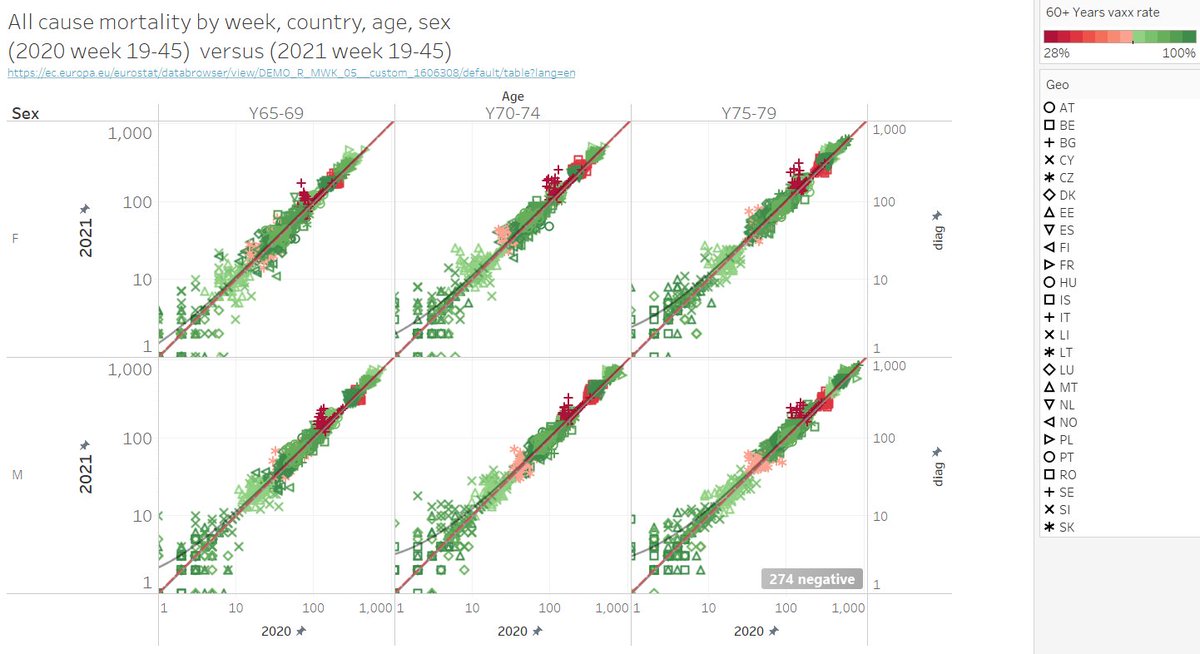
And how does this 0-40 group do with respect to ICU?

I hope it makes clear, how evil it is what the Dutch society is doing to themselves and their future generation. Unforgivable.

#persconferentie #ongevaccineerden Image
Image

• • •

Missing some Tweet in this thread? You can try to force a refresh
 

Keep Current with Orwell2024

Orwell2024 Profile picture

Stay in touch and get notified when new unrolls are available from this author!

Read all threads

This Thread may be Removed Anytime!

PDF

Twitter may remove this content at anytime! Save it as PDF for later use!

Try unrolling a thread yourself!

how to unroll video
  1. Follow @ThreadReaderApp to mention us!

  2. From a Twitter thread mention us with a keyword "unroll"
@threadreaderapp unroll

Practice here first or read more on our help page!

More from @orwell2022

30 Nov
1/ Europe infant mortality trend. Let's have a look how NL compares with other peers.

Not so good.

Note that this is dominated by the 0-1 year group. But unfortunately, the population is only available by 0-5 years. So by averaging death_Y_LT5 / pop_LT5 we dilute a bit. Image
2/ Let's add some more countries. Romania and Bulgaria are on the way to leave NL behind.

I'm wondering what the plan is in NL @hugodejonge? Becoming the last soon? Image
3/ How does 2020 look like compared to peers? Image
Read 7 tweets
25 Nov
1/ Can we (theoretically) see vaccination deaths in all cause mortality? Difficult...

Let's take NL as example.

Even with a vaxx mortality of 1:10k (which is very high), we expect it to be buried in the background of mortality.

👉Maybe for <30y @OS51388957 @connolly_s
2/ The problem is that the vaccination will be diluted over many weeks.

I assumed that e.g. 10% of the population in an age group will vaccinate per week. Then this gives the expected weekly vaxx death background (red for 1:10k vaxx CFR-->1:100k, and blue 1:50k CFR-->1:500k).
3/ So we could maybe see it for the below 30y. But here, also the vaxx CFR is rather >>1:100k. So difficult. Maybe in cases when a lot of people vaccinated in the same week.

That's what @OS51388957 is hunting. He knows what he is doing. 😎🤙💪
Read 9 tweets
25 Nov
1/ DE Corona Bußgeld Katalog. Dann schauen wir mal.

👉Ein Verstoß ist jetzt eine Straftat.

👉Freiheitsstrafe möglich.

👉Alle Bürger sind potentielle Verbrecher.

Rasen mit 240 km/h ohne Tempolimit in DE ist natürlich erlaubt. Macht Sinn.

bussgeldkatalog.org/corona-bayern/ Image
2/ Es drohen 25.000€ persönliche strafe für einen Geschäftsführer der die Einhaltung der Maßnahmen nicht bei seinen Mitarbeitern durchsetzt.

Man muss aktiv mitmachen. Nicht mitmachen ist eine Straftat. Jeder muss Corona Polizist werden. Image
3/ Und der hier ist besonders gut: wenn die Coronapolizei deinen Betrieb kontrolliert und du einen Zeugen dazu holst der nicht für die Kontrolle benötigt wird bekommst du 5000€ Strafe.

👉Zeugen unerwünscht.

Macht Sinn. Das würde ich als Despot auch so verordnen. Image
Read 4 tweets
24 Nov
1/ „Herzlich willkommen mit 2G.“

Deutschland geht 2G.

Schmutzige gesunde junge Kinder und junge Menschen unerwünscht. Image
2/ Zutritt nur noch geimpft oder genesen, allerdings nicht älter als 6 Monate. Das Geheimnis? Er darft nach Spritze für ein paar Monate Privilegien genießen. ImageImageImageImage
3/ Ein kleiner Weihnachtsmarkt für geimpfte. Der neue Rotary Club. Endlich fühlt sich der normale Bürger mal exklusiv. Image
Read 9 tweets
24 Nov
1/ Yesterday we had a poll on mortality vs. vaxx rate for the young (15y-29y).

Result (data): no obvious correlation. Not even for the 20-24 year old males, the group with the known (mRNA) myocarditis risk. See e.g. the map.

Today: The elderly (65+). But first a poll 😀
2/ So for the above 65 years olds (where vaxxing is claimed being the most urgent thing apparently), what are your expectations?

Results are ready, but let's give you some time to reflect😀

@jens_140081 @mr_Smith_Econ @OS51388957 @connolly_s @SHomburg @USMortality
3/ Like yesterday:

first the EC all cause mortality raw data 2020 vs. 2021 (no aggregation: each point is one week).

age: (left) 65-69, (mid) 70-74, (right) 75-79
males (bottom), females (top)
colour by vaxx rate 65+, symbol by country

Pretty diagonal. No💉 correlation. 🧐
Read 25 tweets
23 Nov
First: raw data correlation 2020 vs. 2021.

left: lin-lin
right: log-log
symbol: country
Colour: vaxx rate (%) for the 18-24 age
each point is one week

Looks ok now. So let's aggregate.
We sum mortality of weeks 19-39 for 2020 and 2021.

Then plot SUM(2020 W19:W39) vs. SUM(2021 W19:W39) by age, sex.

symbol: country
colour: vaxx rate (%) for the 18-24 age

Diagonal (with some excursion), as expected.

Now let's do more and define an "excess".
Now let's define a "2021 excess" as

SUM(mortality 2021 W19:39) - SUM(mortality 2020 W19:39)

We now plot excess vs vaxx rate by country, age, sex.

Finally: the correct answer was
A ✅
B ❌
C ❌
I cannot see any correlation.
Read 7 tweets

Did Thread Reader help you today?

Support us! We are indie developers!


This site is made by just two indie developers on a laptop doing marketing, support and development! Read more about the story.

Become a Premium Member ($3/month or $30/year) and get exclusive features!

Become Premium

Too expensive? Make a small donation by buying us coffee ($5) or help with server cost ($10)

Donate via Paypal

Thank you for your support!

Follow Us on Twitter!

:(