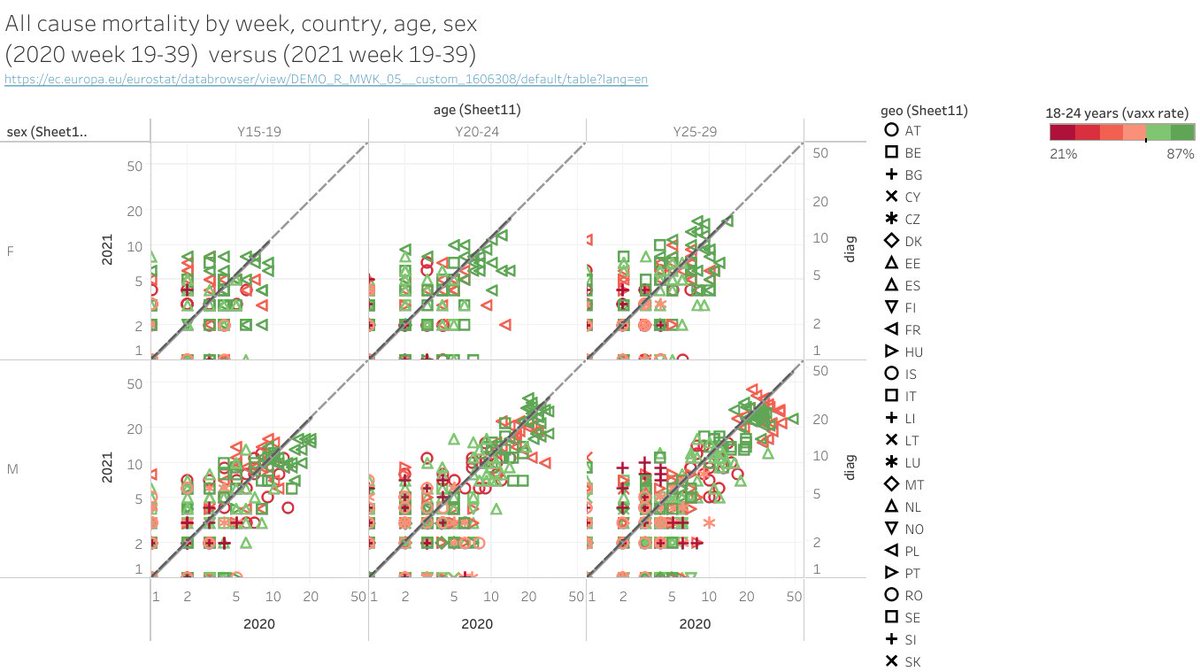
First: raw data correlation 2020 vs. 2021.
left: lin-lin
right: log-log
symbol: country
Colour: vaxx rate (%) for the 18-24 age
each point is one week
Looks ok now. So let's aggregate.

left: lin-lin
right: log-log
symbol: country
Colour: vaxx rate (%) for the 18-24 age
each point is one week
Looks ok now. So let's aggregate.


We sum mortality of weeks 19-39 for 2020 and 2021.
Then plot SUM(2020 W19:W39) vs. SUM(2021 W19:W39) by age, sex.
symbol: country
colour: vaxx rate (%) for the 18-24 age
Diagonal (with some excursion), as expected.
Now let's do more and define an "excess".
Then plot SUM(2020 W19:W39) vs. SUM(2021 W19:W39) by age, sex.
symbol: country
colour: vaxx rate (%) for the 18-24 age
Diagonal (with some excursion), as expected.
Now let's do more and define an "excess".

Now let's define a "2021 excess" as
SUM(mortality 2021 W19:39) - SUM(mortality 2020 W19:39)
We now plot excess vs vaxx rate by country, age, sex.
Finally: the correct answer was
A ✅
B ❌
C ❌
I cannot see any correlation.
SUM(mortality 2021 W19:39) - SUM(mortality 2020 W19:39)
We now plot excess vs vaxx rate by country, age, sex.
Finally: the correct answer was
A ✅
B ❌
C ❌
I cannot see any correlation.

Closer look on the 20-24 year old boys. I can't see any correlation.
We should normalize by the population size to get a relative excess which is not distorted by the country bin size, but that shouldn't change a lot.
We should normalize by the population size to get a relative excess which is not distorted by the country bin size, but that shouldn't change a lot.

Find here the dashboard with the joint dataset (after joining 3 sets: vaxx rate, mort. 2020, mort. 2021).
public.tableau.com/authoring/Mort…
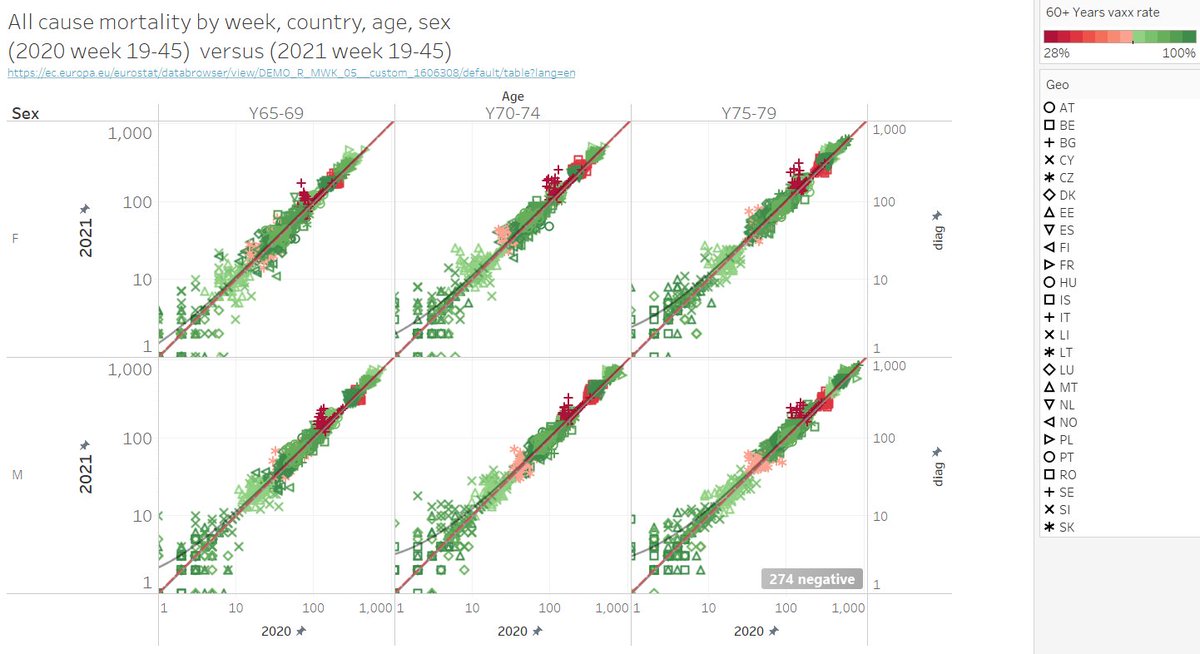
Next time: same game for the elderly age bins. At some point, this magic, so important serum should give a pos. signal or not?😅
public.tableau.com/authoring/Mort…
Next time: same game for the elderly age bins. At some point, this magic, so important serum should give a pos. signal or not?😅

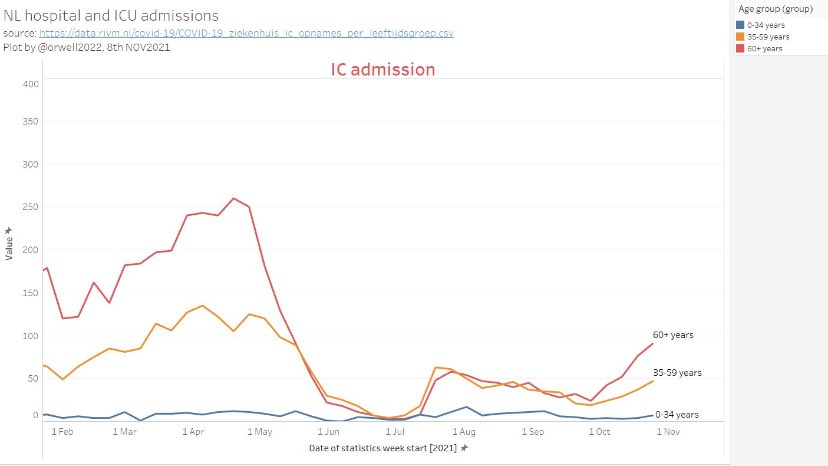
This may help to understand what I plotted. It’s basically the difference over a time window of @OS51388957 cumulative graphs. His graphs are a bit older, so they stop at week 30. But it nevertheless helps to understand I hope.
https://twitter.com/orwell2022/status/1463235676246319113
Upon request on latitude.
Here are the vaxx rate (left) and excess (right) maps for males 20-24
👉No excess correlation with latitude nor vaxx rate.
Note that DE is not in the EC data base. 🧐
https://twitter.com/collapsologist/status/1463216974843060258?s=20
Here are the vaxx rate (left) and excess (right) maps for males 20-24
👉No excess correlation with latitude nor vaxx rate.
Note that DE is not in the EC data base. 🧐

• • •
Missing some Tweet in this thread? You can try to
force a refresh


