Moving Averages 🧵
Widely used indicator by traders but with a lesser understanding of what it reflects and how it should be analysed.
In this thread:
1. MA and possible use case to help you make trading decisions
2. Mean-reversion
3. Disparity
Widely used indicator by traders but with a lesser understanding of what it reflects and how it should be analysed.
In this thread:
1. MA and possible use case to help you make trading decisions
2. Mean-reversion
3. Disparity
2
Moving Average (MA) is a statistical calculation used to analyse a different subset of the full data set. In technical analysis, MA is used as an indicator to help us analyse stock by smoothing out the price data by creating a constantly updated average price
Moving Average (MA) is a statistical calculation used to analyse a different subset of the full data set. In technical analysis, MA is used as an indicator to help us analyse stock by smoothing out the price data by creating a constantly updated average price
3
By calculating the moving average, the impacts of random, short-term fluctuations on the price of a stock over a specified time frame are mitigated.
By calculating the moving average, the impacts of random, short-term fluctuations on the price of a stock over a specified time frame are mitigated.
4
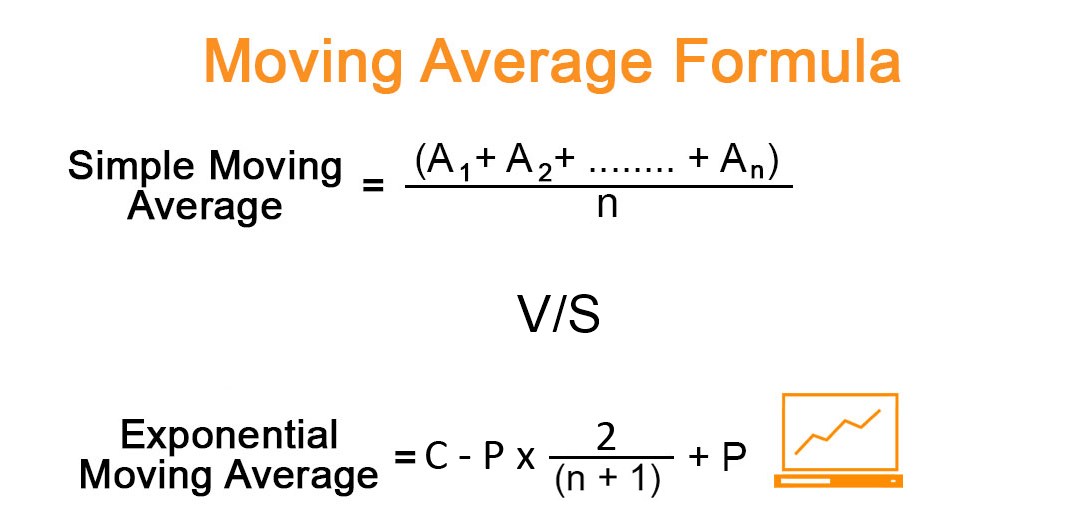
A simple moving average (SMA) is a calculation that takes the arithmetic mean of a given set of prices over the specific number of days in the past; for example, over the previous 21, 50, 89, or 200 days. For example, Formula of 21-SMA = (P1+P2+….P21)/21
A simple moving average (SMA) is a calculation that takes the arithmetic mean of a given set of prices over the specific number of days in the past; for example, over the previous 21, 50, 89, or 200 days. For example, Formula of 21-SMA = (P1+P2+….P21)/21
5
Exponential moving averages (EMA) is a weighted average -gives greater importance to the price of an asset in more recent days, making an indicator that is more responsive to new information. In trading, we generally tend to use EMA instead of SMA for better trading decisions.
Exponential moving averages (EMA) is a weighted average -gives greater importance to the price of an asset in more recent days, making an indicator that is more responsive to new information. In trading, we generally tend to use EMA instead of SMA for better trading decisions.
6
Small Difference between EMA and SMA: Speed of reaction to price
1. SMA moves at a slower pace
2. EMA reacts faster to the price chance
Small Difference between EMA and SMA: Speed of reaction to price
1. SMA moves at a slower pace
2. EMA reacts faster to the price chance

7
Now, the important part comes: what are we analysing with help of EMA/SMA:
1. Trend
2. Supply and Demand (Buyer and Seller) Equation
3. Zone (Area of Value) for our trading decision
Now, the important part comes: what are we analysing with help of EMA/SMA:
1. Trend
2. Supply and Demand (Buyer and Seller) Equation
3. Zone (Area of Value) for our trading decision
8
Typically, MA is plotted using Closing Price. We can also consider other data sets. For instance, high or low value. As we have understood from the formula, for calculation, we need only one data point. MA is a good indicator to identify the Area of Value.
Typically, MA is plotted using Closing Price. We can also consider other data sets. For instance, high or low value. As we have understood from the formula, for calculation, we need only one data point. MA is a good indicator to identify the Area of Value.
9
If plotted with closing price, it signifies the Avg buying price of a particular asset. This gives you a probable action area and what you should expect from the stock if it visits again. For inherently bullish stock, MAs will act as Demand Zone (Dynamic Support).
If plotted with closing price, it signifies the Avg buying price of a particular asset. This gives you a probable action area and what you should expect from the stock if it visits again. For inherently bullish stock, MAs will act as Demand Zone (Dynamic Support).

10
MA can use used as a Trend filter:
- If stock is trading above MA, we can say the stock is Bullish
- If stock is trading below MA, we can say the stock is Bearish
MA should be used to find areas of Value. Price confirmation in conjunction with MA will be a deadly tool to trade
MA can use used as a Trend filter:
- If stock is trading above MA, we can say the stock is Bullish
- If stock is trading below MA, we can say the stock is Bearish
MA should be used to find areas of Value. Price confirmation in conjunction with MA will be a deadly tool to trade
11
IMPORTANT MA: Every asset has its own pace of growth and decline. Some stock will take support from 21 EMA, some may take from 200 EMA. From my experience, I have found 89 and 200 EMA the most reliable for positional trades. Most of the assets respect these EMA levels.
IMPORTANT MA: Every asset has its own pace of growth and decline. Some stock will take support from 21 EMA, some may take from 200 EMA. From my experience, I have found 89 and 200 EMA the most reliable for positional trades. Most of the assets respect these EMA levels.
12
For inherently bullish stock (Positive CAGR), MAs will act as probable Demand Zone (Dynamic Support).
For inherently bullish stock (Positive CAGR), MAs will act as probable Demand Zone (Dynamic Support).

13
Likewise, for inherently bearish stock (negative CAGR), MAs will act as Supply Zone (Dynamic Resistance.
Likewise, for inherently bearish stock (negative CAGR), MAs will act as Supply Zone (Dynamic Resistance.

14
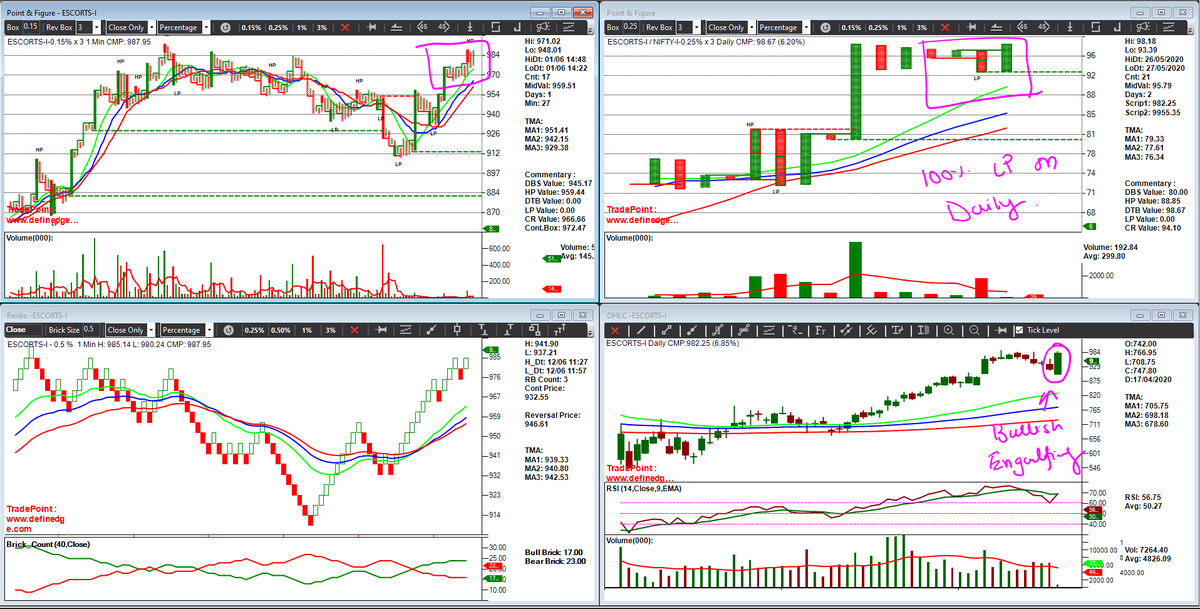
Once the concept of MAs is understood well, it can be applied to all types of charts. The analysis remains the same. With help of MA, we are interested in analysing the trend and finding areas of value to participate in the trend.
Once the concept of MAs is understood well, it can be applied to all types of charts. The analysis remains the same. With help of MA, we are interested in analysing the trend and finding areas of value to participate in the trend.

15
MA channels. For MA, you need only one data point for X number of periods. In OHLC charts, you have 4 data points – OPEN, HIGH, LOW, and CLOSE. So, to form a channel: plot 2 MA using 2 different data sets.
MA channels. For MA, you need only one data point for X number of periods. In OHLC charts, you have 4 data points – OPEN, HIGH, LOW, and CLOSE. So, to form a channel: plot 2 MA using 2 different data sets.

16
If the entire candle range channel of the stock is to be known, plot using High and Low data set. If body range is to be analysed try plotting using OPEN and CLOSE. We will use MA - HIGH LOW Channel as we are interested in learning the range of the asset.
If the entire candle range channel of the stock is to be known, plot using High and Low data set. If body range is to be analysed try plotting using OPEN and CLOSE. We will use MA - HIGH LOW Channel as we are interested in learning the range of the asset.

17
When analysing charts based on MA there are two cases:
CASE-1 Price is trading above MA Channel and
CASE-2 Price trading below MA Channel.
In the subsequent tweet, I will explain both cases in detail with charts.
When analysing charts based on MA there are two cases:
CASE-1 Price is trading above MA Channel and
CASE-2 Price trading below MA Channel.
In the subsequent tweet, I will explain both cases in detail with charts.
18
CASE-1
This shows that people who have bought the asset are in profits as MA is below the CMP.
So, investors who are in profit will tend to square off the position. This will lead to supply in assets. Price may start correcting.
CASE-1
This shows that people who have bought the asset are in profits as MA is below the CMP.
So, investors who are in profit will tend to square off the position. This will lead to supply in assets. Price may start correcting.

19
CASE-2
This shows that people who have Sold the asset are in profits as Avg sell price (MA value) is significantly above the CMP.
So FNO traders who are in profit will tend to square off the position.
This will lead to demand for assets. So, the price will start correcting.
CASE-2
This shows that people who have Sold the asset are in profits as Avg sell price (MA value) is significantly above the CMP.
So FNO traders who are in profit will tend to square off the position.
This will lead to demand for assets. So, the price will start correcting.
20
Mean Reversion: Financial term for the assumption that an asset's price will tend to converge to the average price over time. A technique used in computation of the average price using quantitative methods.
Combining Case 1&2 you will understand how mean reversion takes place
Mean Reversion: Financial term for the assumption that an asset's price will tend to converge to the average price over time. A technique used in computation of the average price using quantitative methods.
Combining Case 1&2 you will understand how mean reversion takes place
21
The disparity index is a technical indicator that measures the relative position of an asset's most recent closing price to a selected MA and reports the value as a percentage
Higher Disparity: Chances to revert back to mean
Lower Disparity: Chances to go away from mean
The disparity index is a technical indicator that measures the relative position of an asset's most recent closing price to a selected MA and reports the value as a percentage
Higher Disparity: Chances to revert back to mean
Lower Disparity: Chances to go away from mean
I will explain Disparity Index in detail in my coming threads as part of this Twitter Thread Series
22
Using the Disparity Index and the Contra trend pattern, one can develop their own mean-reversion trading strategy. MAs are important trend indicators if used correctly with understanding one can frame its own simple trading strategy
Using the Disparity Index and the Contra trend pattern, one can develop their own mean-reversion trading strategy. MAs are important trend indicators if used correctly with understanding one can frame its own simple trading strategy
23
Conclusion: MAs should be used as a Trend filter and should not be traded Standalone. Price confirmation is needed to initiate the trade.
Rising MA suggest - Bullish
Falling MA suggest - Bearish
Conclusion: MAs should be used as a Trend filter and should not be traded Standalone. Price confirmation is needed to initiate the trade.
Rising MA suggest - Bullish
Falling MA suggest - Bearish
24
If this thread helped you, please re-tweet and help other fellow traders in their learning curve.
If you like my content, follow me on @kaushikaki
Subscribe to my YT channel: youtube.com/c/TheNoiseless…
Join telegram channel: t.me/thenoiselesstr…
If this thread helped you, please re-tweet and help other fellow traders in their learning curve.
If you like my content, follow me on @kaushikaki
Subscribe to my YT channel: youtube.com/c/TheNoiseless…
Join telegram channel: t.me/thenoiselesstr…
• • •
Missing some Tweet in this thread? You can try to
force a refresh