Proxying for @Golden_Pup
1) Ontario is reporting 666 new cases and 467 resolved cases of #COVID19 today.
18% (120) of the cases began over a week ago, dating back as far as March 2021.
cases were added without a positive test.
#COVID19ON #onpoli
1) Ontario is reporting 666 new cases and 467 resolved cases of #COVID19 today.
18% (120) of the cases began over a week ago, dating back as far as March 2021.
cases were added without a positive test.
#COVID19ON #onpoli

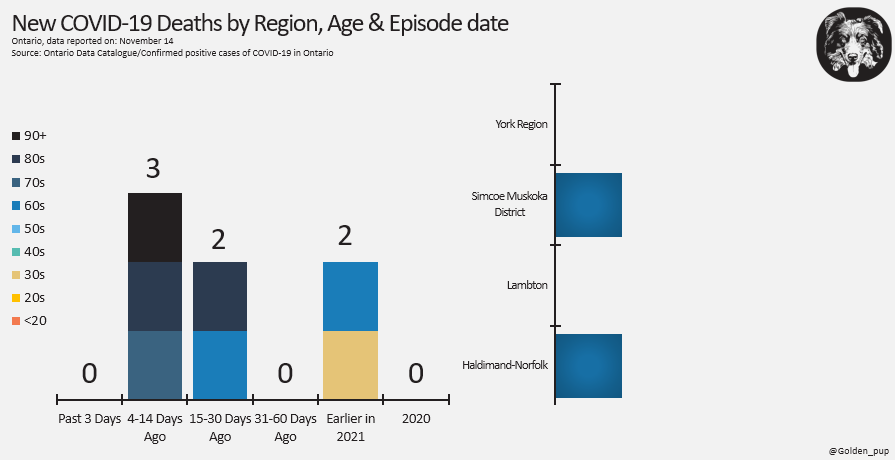
2) Ontario is also reporting 7 new deaths with COVID-19 today.
4 of the deaths were individuals over 70.
1 of the deaths were individuals under 40.
The deaths come from cases dating as far back as March 2021.
4 of the deaths were individuals over 70.
1 of the deaths were individuals under 40.
The deaths come from cases dating as far back as March 2021.
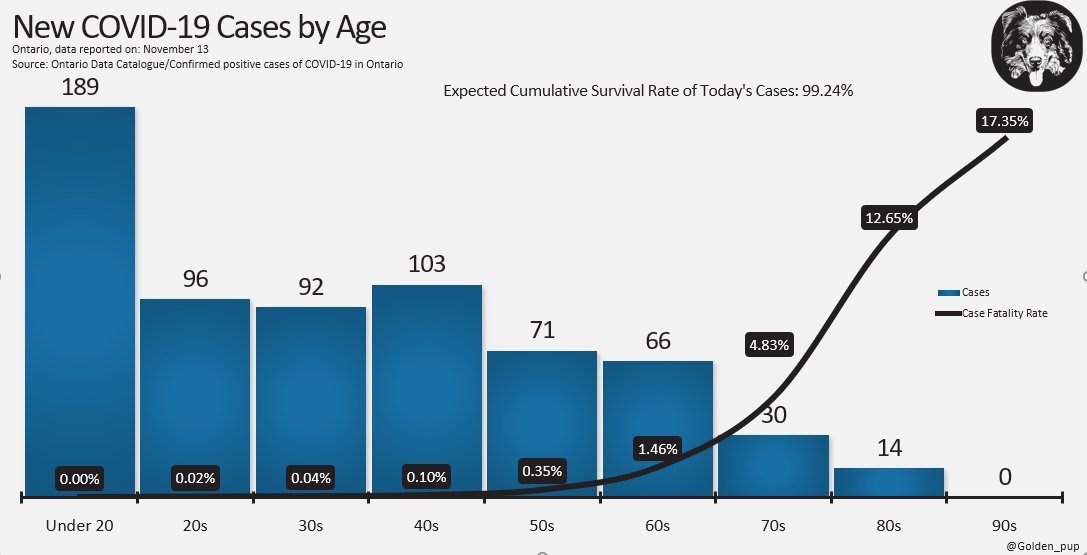
"3) Based on the age distribution of the cases reported today, and using their case fatality rates from wave 3, 98.95% of the cases announced today would be expected to survive.
This is a chart showing the age distribution for the cases announced today, along with their CFR's."
This is a chart showing the age distribution for the cases announced today, along with their CFR's."

4) For reference and context, below is a chart on where each PHU would land if we were to return to the colour-coded framework.

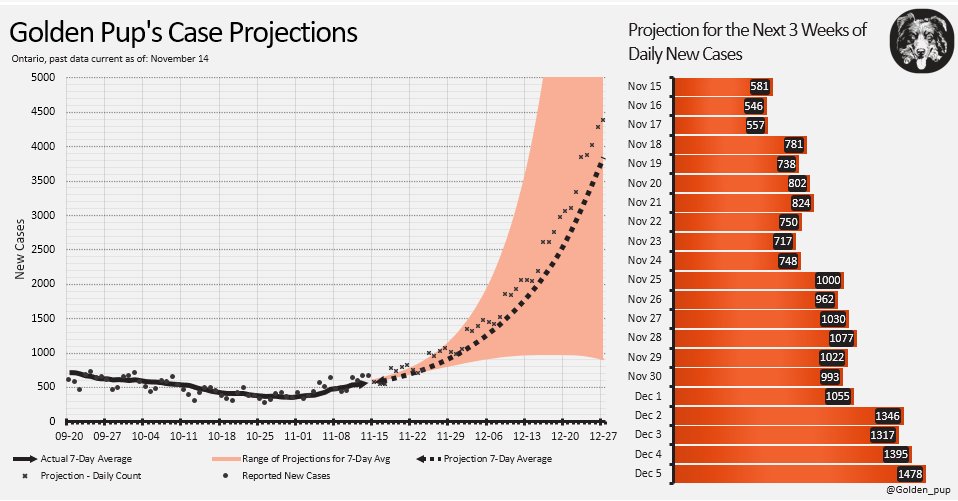
5) The 7-day avg is now 563. It's up 20% from one week ago and 61% from two weeks ago.
Attached is forecast for the next six weeks of case counts.
Attached is forecast for the next six weeks of case counts.
6) @COVIDSciOntario's October 22nd Modeling (7-Day Average):
Low/Status Quo: 230 (-333)
Mid: 501 (-62)
High: 593 (+30)
Low/Status Quo: 230 (-333)
Mid: 501 (-62)
High: 593 (+30)

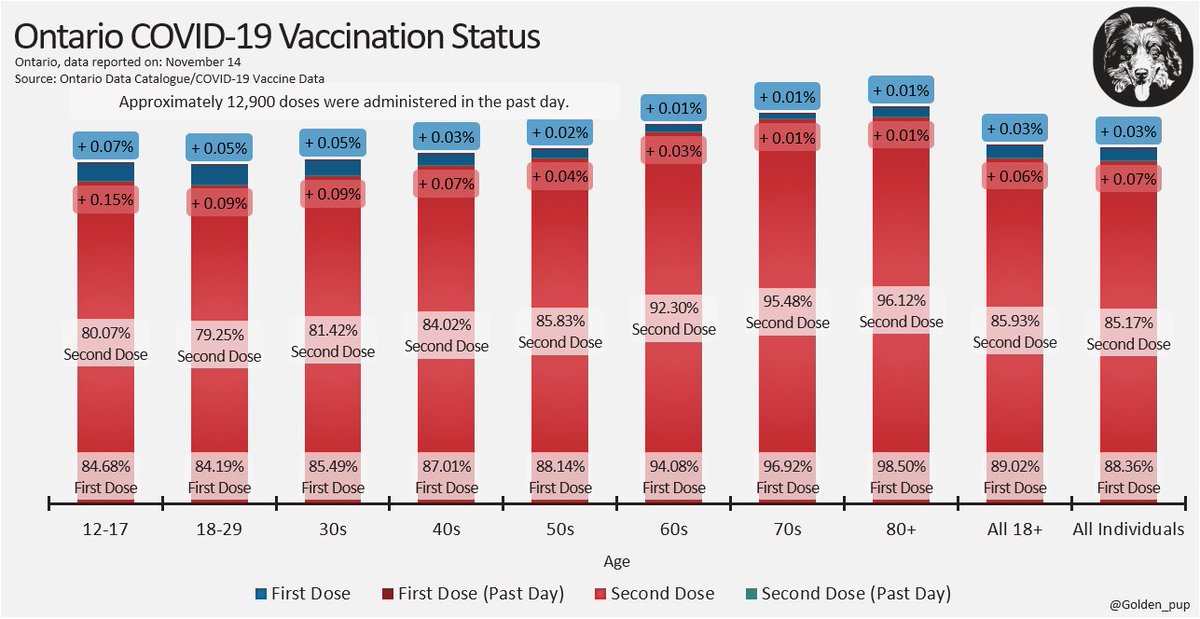
7) As of today, 88.36% of those aged 12 and up have been vaccinated w/ one dose, 85.17% are fully vaccinated.
Approximately 12,900 doses were administered in the past day.
Approximately 12,900 doses were administered in the past day.
8) Unvax'd: 45% of cases, 62% of hospitalizations, 48% of ICU admissions.
Partially vax'd: 4% of cases, 13% of hospitalizations, 2% of ICU admissions.
Fully vax'd: 45% of cases, 55% of hospitalizations, 10% of ICU admissions.
See below for pop.-adjusted rates.
Partially vax'd: 4% of cases, 13% of hospitalizations, 2% of ICU admissions.
Fully vax'd: 45% of cases, 55% of hospitalizations, 10% of ICU admissions.
See below for pop.-adjusted rates.

9) Hospitalizations: 126 - 5% of Peak
-137 since yesterday
ICU Occupancy: 133 - 15% of Peak
2 since yesterday
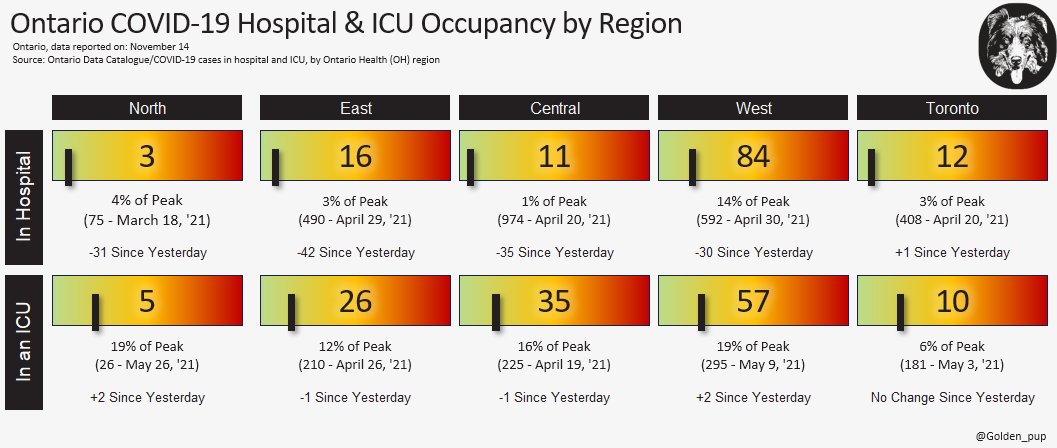
No health region in Ontario exceeds 14% of its previous max of COVID patients, nor do they exceed 19% of their previous max COVID ICU occupancy.
-137 since yesterday
ICU Occupancy: 133 - 15% of Peak
2 since yesterday
No health region in Ontario exceeds 14% of its previous max of COVID patients, nor do they exceed 19% of their previous max COVID ICU occupancy.
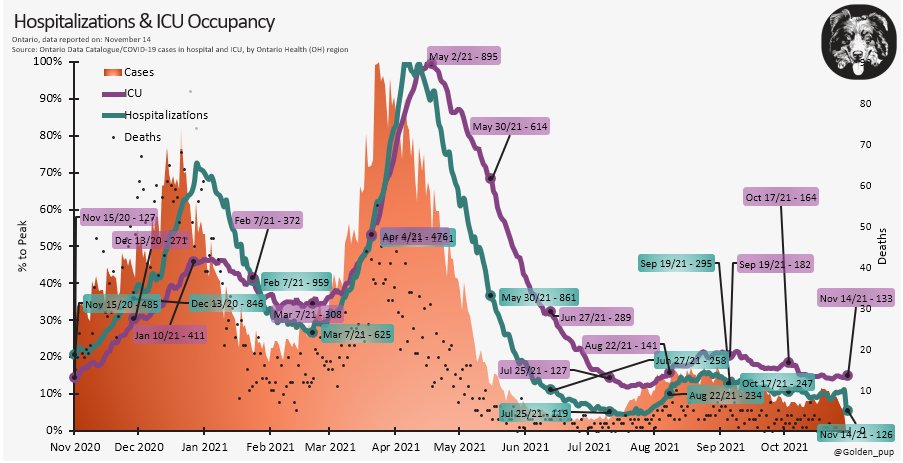
10) Here is a timeline of notable events and policy pertaining to COVID-19 in Ontario.
Cases, hospitalizations and ICU occupancy are plotted against their previous peaks in Wave 3, with those peaks being displayed as the dashed line at the top.
Cases, hospitalizations and ICU occupancy are plotted against their previous peaks in Wave 3, with those peaks being displayed as the dashed line at the top.

11) The goal of these tweets is to contextualize & point out anomalies in the daily data provided by the Ontario gov't.
Most of the data comes from comparing day to day snapshots of this database: data.ontario.ca/en/dataset/con…
Most of the data comes from comparing day to day snapshots of this database: data.ontario.ca/en/dataset/con…
• • •
Missing some Tweet in this thread? You can try to
force a refresh