
1/ For the last 12 months or so, I've been banging on about the housing market being in a bubble.
I believe that there is a substantial dislocation between the price and the intrinsic value of housing.
In this thread I will outline my case.
#housing #RealEstate #investing
I believe that there is a substantial dislocation between the price and the intrinsic value of housing.
In this thread I will outline my case.
#housing #RealEstate #investing
2/ My valuation assumes:
A) Intrinsic value of housing comes from rent you could charge (or don't charge yourself)
B) Rents cannot grow faster than economy forever
C) Economy will grow at risk-free rate
D) No growth reinvest required
How has this model performed historically?
A) Intrinsic value of housing comes from rent you could charge (or don't charge yourself)
B) Rents cannot grow faster than economy forever
C) Economy will grow at risk-free rate
D) No growth reinvest required
How has this model performed historically?
3/ I have plotted Real Price and Rent Indexes for Amsterdam and the Gov Bond Rate, going back to 1620.
Buying in 1619 and selling in 1986, netted you nothing in real capital gains. But, in the 35 years since, prices are up 559 per cent.
Buying in 1619 and selling in 1986, netted you nothing in real capital gains. But, in the 35 years since, prices are up 559 per cent.

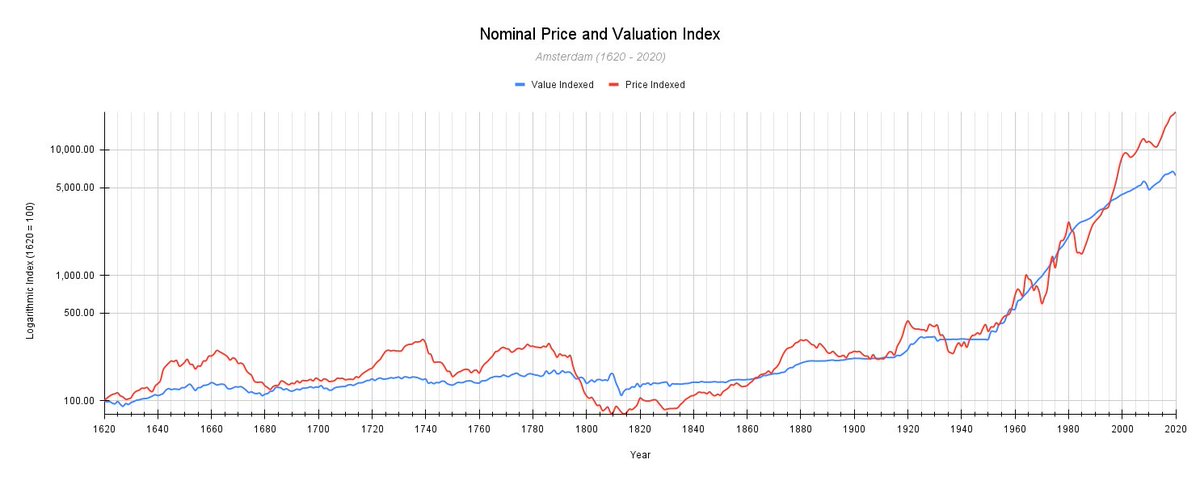
4/ Next, I plot the nominal price and my valuation indexes (log-scale). These two indexes have a 0.94 correlation (p<0.01) and a chi-squared test yields a p<0.01 result.
This estimator of intrinsic value has been excellent over time and on average.
This estimator of intrinsic value has been excellent over time and on average.
5/ Then, I plot the difference between the price and valuation indexes and overlay major events. We can see that housing has had bubble phases that often start with periods of investment euphoria/speculation and end with political upheaval, war, or recession.
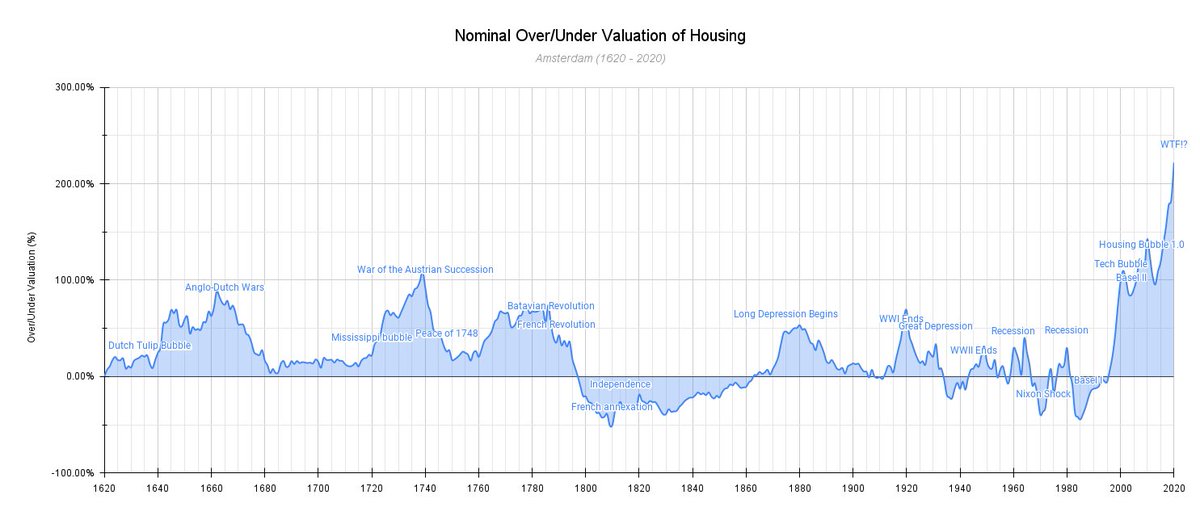
6/ What are the lessons of history? If we define a bubble as a period with >25 per cent overvaluation, then Amsterdam has had five bubbles since 1620:
1641-1679
1721-1754
1759-1794
1873-1889
1917-1931
1641-1679
1721-1754
1759-1794
1873-1889
1917-1931
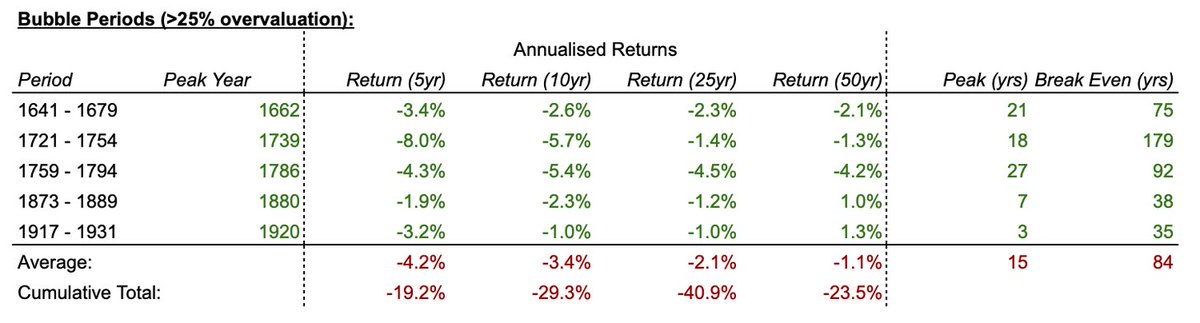
7/ The average time from bubble beginning to reaching the peak, was 15 years. The most extended building was 27 years for the 1759-1794 bubble.
8/ If you bought around the peak, the average break-even time (nominal) was 84 years. Buying around 1739 took 179 years to break even.
9/ Buying around the peak resulted in average annualised returns of:
5 years: -4.2 per cent pa
10 years: -3.4 per cent pa
25 years: -2.1 per cent pa
50 years: -1.1 per cent pa
5 years: -4.2 per cent pa
10 years: -3.4 per cent pa
25 years: -2.1 per cent pa
50 years: -1.1 per cent pa
10/ What's more, there is statistically significant relationship (p<0.01) between over/undervaluation and future performance. Overvaluation is a good predictor of negative returns, and undervaluation is a good predictor of positive returns.
End/ For Amsterdam, we are 22 years into the current bubble - seven more years than the average, and five fewer years than the previous longest buildup.
Moreover, the current bubble is dramatically larger than any previous, suggesting more pronounced negative future returns.
Moreover, the current bubble is dramatically larger than any previous, suggesting more pronounced negative future returns.
• • •
Missing some Tweet in this thread? You can try to
force a refresh


