
Went over the weekly tf for #Bitcoin and want to share my thoughts. This thread will definitely help you create your own opinion whether or not the bottom is in!
Dont start reading this thread expecting a clear yes or no. Read it and make up your own mind! Let the facts guide u!
Dont start reading this thread expecting a clear yes or no. Read it and make up your own mind! Let the facts guide u!


1/ --- Fib Targets ---
The Charts are as always very self-explaining. Will just try to explain here my thoughts as good as possible.
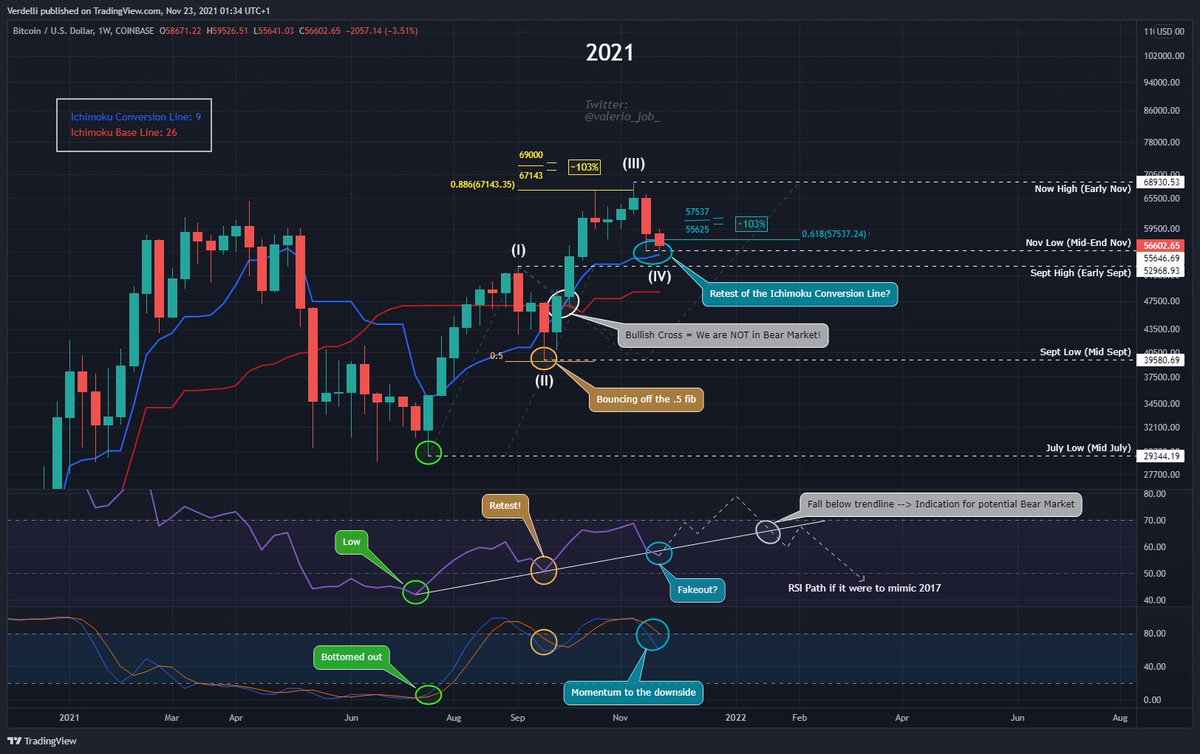
What fascinates me the most is that a top for wave (III) of ~ $69k could have actually been expected.
Why?
The Charts are as always very self-explaining. Will just try to explain here my thoughts as good as possible.
What fascinates me the most is that a top for wave (III) of ~ $69k could have actually been expected.
Why?


1a/
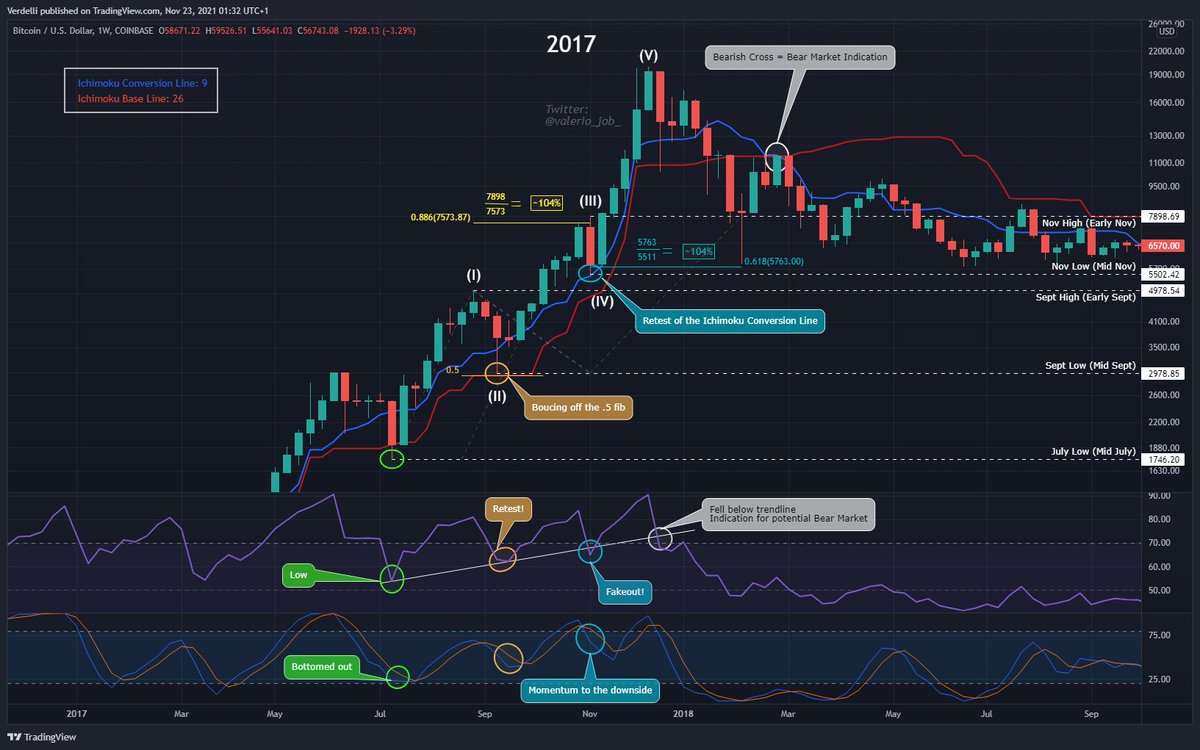
Well first, please have a look at how I counted the 5 Elliot waves. From July on we can find a similar 5-waves structure in 2021 & 2017. The bottom of wave II was in both cycles exactly at the 0.5 fib drawn from wave I bottom to wave I peak.
Why? 'Cause emotions dont change
Well first, please have a look at how I counted the 5 Elliot waves. From July on we can find a similar 5-waves structure in 2021 & 2017. The bottom of wave II was in both cycles exactly at the 0.5 fib drawn from wave I bottom to wave I peak.
Why? 'Cause emotions dont change


1b/
Also if you draw the trend based fib from start of wave I to wave I peak to wave II low you get a fib target of 0.886 fib for the top of wave III. In fact in in 2017 wave III topped around 4% higher than the .886fib while this year wave III also topped around 3% higher!
Also if you draw the trend based fib from start of wave I to wave I peak to wave II low you get a fib target of 0.886 fib for the top of wave III. In fact in in 2017 wave III topped around 4% higher than the .886fib while this year wave III also topped around 3% higher!


1c/
Don't understand me wrong, I'm not saying that back in sept this year right after wave II low, you definitely should have known wave (III) tops at 69k. No not at all, I'm only saying that you could've at least considered $68k++ as potential top targets.
Don't understand me wrong, I'm not saying that back in sept this year right after wave II low, you definitely should have known wave (III) tops at 69k. No not at all, I'm only saying that you could've at least considered $68k++ as potential top targets.


1d/
That brings us now to our price target for this current wave 4 bottom based on fibs. So again, trend based fib from (I) peak - (II) low - (III) peak gives u the .618fib as a pot target for wave (IV). In 2017 we fell 4% further than the .618fib and in 2021 around 3% so far!
That brings us now to our price target for this current wave 4 bottom based on fibs. So again, trend based fib from (I) peak - (II) low - (III) peak gives u the .618fib as a pot target for wave (IV). In 2017 we fell 4% further than the .618fib and in 2021 around 3% so far!


2/ --- Ichimoku - Conversion & Base Line ---
Of course the Ichimoku Conversion & Base Line don't look the same in 2017 and 2021 prior to Wave (II). The main reason obviously being the big mid cycle peak in Apr-21 whereas we didn't see such a big mid cycle peak in 2017.
Of course the Ichimoku Conversion & Base Line don't look the same in 2017 and 2021 prior to Wave (II). The main reason obviously being the big mid cycle peak in Apr-21 whereas we didn't see such a big mid cycle peak in 2017.

2a/
But approx. from wave (III) on the conversion & base line start to look very similar. In 2017 wave (IV) just perfectly retested the blue Ichimoku conversion line and this year so far it looks like wave (IV) again found support at the conversion line.
But approx. from wave (III) on the conversion & base line start to look very similar. In 2017 wave (IV) just perfectly retested the blue Ichimoku conversion line and this year so far it looks like wave (IV) again found support at the conversion line.


2b/
The current value of the conversion line is ~ $54,675. Of course it's not 100% guaranteed that this conversion line will hold again for this cycle, but remember, emotions don't change. Do whatever you want with this information!
The current value of the conversion line is ~ $54,675. Of course it's not 100% guaranteed that this conversion line will hold again for this cycle, but remember, emotions don't change. Do whatever you want with this information!


2c/
Education:
You can interpret the conversion & base line similar to how you interpret the 20 & 50 EMA. When the 20EMA crosses above the 50EMA that often indicates an uptrend. And the same is true for the Conversion & Base line plus they're often even more accurate.
Education:
You can interpret the conversion & base line similar to how you interpret the 20 & 50 EMA. When the 20EMA crosses above the 50EMA that often indicates an uptrend. And the same is true for the Conversion & Base line plus they're often even more accurate.


3/ --- RSI ---
In both RSIs, 2017 & 2021, we can find an important trendline starting from the beginning of wave (I) (green area in chart). We saw a perfect retest of this RSI trendline right as we marked the wave (II) low!
In both RSIs, 2017 & 2021, we can find an important trendline starting from the beginning of wave (I) (green area in chart). We saw a perfect retest of this RSI trendline right as we marked the wave (II) low!


3a/
While we marked the wave (IV) low in 2017 we actually fell below this RSI trendline simultaneously which at first sight is not a bullish sign. But it turned out to be just a quick fake out. The following week we immediately got back above the trendline.
While we marked the wave (IV) low in 2017 we actually fell below this RSI trendline simultaneously which at first sight is not a bullish sign. But it turned out to be just a quick fake out. The following week we immediately got back above the trendline.

3b/
Now for the current wave (IV) we again simultaneously fell below the RSI trendline! The question now is: Will this be a fakeout again like we had in 2017?
Here is where the opinions of bears🐻 & bulls🐂 will differ!
Tbh I get both pov's BUT...
Now for the current wave (IV) we again simultaneously fell below the RSI trendline! The question now is: Will this be a fakeout again like we had in 2017?
Here is where the opinions of bears🐻 & bulls🐂 will differ!
Tbh I get both pov's BUT...

3c/
Tbh I get both pov's BUT in regards of so many other indicators telling us that we're still in a bull market they answer is pretty simple for me. For the ones that did not understand: There is a high possibility that the answer to this previous question is "yes"!
Tbh I get both pov's BUT in regards of so many other indicators telling us that we're still in a bull market they answer is pretty simple for me. For the ones that did not understand: There is a high possibility that the answer to this previous question is "yes"!


4/ --- StochRSI ---
Now eventhough the weekly momentum in the StochRSI looks shit rn and I just quickly wanted to share why I wouldn't be that negative about it.
I mean see the charts and compare the 2 StochRSI's for yourself!
Now eventhough the weekly momentum in the StochRSI looks shit rn and I just quickly wanted to share why I wouldn't be that negative about it.
I mean see the charts and compare the 2 StochRSI's for yourself!

4a/
In 2017, when we marked the wave (IV) low the weekly momentum was also looking very very bad in the StochRSI. That's why I am actually not that worried about it! But please, create your own opinion!
In 2017, when we marked the wave (IV) low the weekly momentum was also looking very very bad in the StochRSI. That's why I am actually not that worried about it! But please, create your own opinion!


5/ --- Rounding off ---
Yes I again went back to 2017 and checked how the weekly chart was looking like..and I got so fascinated by the similarities that I thought I had to share this!
Now to all the haters:
Yes I again went back to 2017 and checked how the weekly chart was looking like..and I got so fascinated by the similarities that I thought I had to share this!
Now to all the haters:
5a/
Also, there is no point of spamming "You can't compare these cycles, because 2017 was in a whole different context". Yes, I know that even though Jul-Nov 17 looks similar to Jul-Nov21 PA-wise, the PA prior to July was very much different in 2017 than it was 2021.
Also, there is no point of spamming "You can't compare these cycles, because 2017 was in a whole different context". Yes, I know that even though Jul-Nov 17 looks similar to Jul-Nov21 PA-wise, the PA prior to July was very much different in 2017 than it was 2021.
5b/
But that still doesn't change the fact that human beings are the same emotional species now AND 4 years ago. Trust me, people and especially people's emotions don't change that much, especially not after only 4 years! And imo emotions are a big part & reason why TA exists!
But that still doesn't change the fact that human beings are the same emotional species now AND 4 years ago. Trust me, people and especially people's emotions don't change that much, especially not after only 4 years! And imo emotions are a big part & reason why TA exists!
Thank you everyone for reading this thread. I really hope you learned something. Please let me know your honest opinion in the comments!⬇️
Also I'd really appreciate if you'd like and RT this thread as this required a lot of hard work any many hours of not studying for Uni :)
Also I'd really appreciate if you'd like and RT this thread as this required a lot of hard work any many hours of not studying for Uni :)
• • •
Missing some Tweet in this thread? You can try to
force a refresh


