
What is HEIKIN ASHI i and How You
Use it ?
A Small Thread
Understand New type of Price Representation on charts.
Maximum Retweet and Share !
1/n
@kuttrapali26 @rohanshah619
Use it ?
A Small Thread
Understand New type of Price Representation on charts.
Maximum Retweet and Share !
1/n
@kuttrapali26 @rohanshah619
What is Heikin Ashi?
1. Heikin-Ashi, also called Heiken-Ashi, is translated as an "average bar" in Japanese.
2. The Heikin Ashi strategy is a useful tool used in identifying market trends and
predicting the future prices of assets.
2/N
1. Heikin-Ashi, also called Heiken-Ashi, is translated as an "average bar" in Japanese.
2. The Heikin Ashi strategy is a useful tool used in identifying market trends and
predicting the future prices of assets.
2/N
3. The Heikin Ashi can be used alone or in conjunction with candlestick charts.
4. These charts can be very useful as they make it easier to read candlestick charts
and analyze market trends , without noise
3/n
4. These charts can be very useful as they make it easier to read candlestick charts
and analyze market trends , without noise
3/n

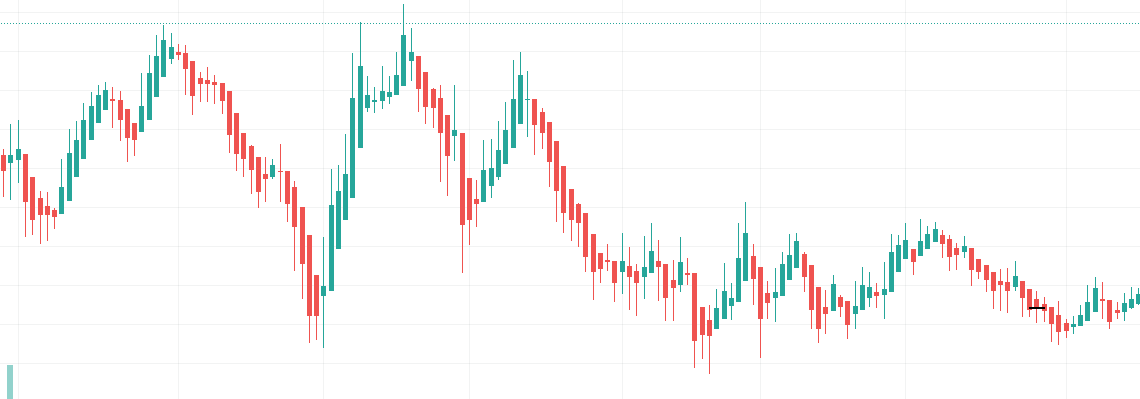
Heikin Ashi vs Candlestick
1. The Heikin Ashi has a few differences with the traditional candlestick chart.
The candles on traditional candlesticks usually change from green to red (up or
down), making it difficult for some traders to interpret.
Candlestick vs Heikin Ashi chart
1. The Heikin Ashi has a few differences with the traditional candlestick chart.
The candles on traditional candlesticks usually change from green to red (up or
down), making it difficult for some traders to interpret.
Candlestick vs Heikin Ashi chart


2.However, the candles on a Heikin Ashi chart display more consecutive colored
candles, making it easy for traders to identify past price movements and current
trends.
3. With Heikin Ashi, charts usually stay green in an uptrend and red in a downtrend.
Calcluation Shared
5/n
candles, making it easy for traders to identify past price movements and current
trends.
3. With Heikin Ashi, charts usually stay green in an uptrend and red in a downtrend.
Calcluation Shared
5/n

How to Use Heikin Ashi to Identify Trends and Trend Strength
1. Because Heikin Ashi candlesticks are calculated using averages, the candlesticks
have smaller shadows or wicks compared to the regular candlesticks.
6/n
1. Because Heikin Ashi candlesticks are calculated using averages, the candlesticks
have smaller shadows or wicks compared to the regular candlesticks.
6/n


2.However, similar to the regular candlesticks, the smaller or shorter the shadow or wick in
Heikin Ashi, the stronger the trend.
7/n
Heikin Ashi, the stronger the trend.
7/n

3. Heiken Ashi is designed to show you the direction of a trend with the help of its
color-coded candles. A green candle indicates that the trend is up, while a red
candle is a sign that the trend is down.
8/n
color-coded candles. A green candle indicates that the trend is up, while a red
candle is a sign that the trend is down.
8/n

4. Green candles without upper shadows show a strong uptrend, while red candles
without lower shadows indicate a strong downtrend.
9/n
without lower shadows indicate a strong downtrend.
9/n


• • •
Missing some Tweet in this thread? You can try to
force a refresh


