
The Heikin Ashi Trading Strategy !
A thread for Swing and Positional Traders who love Reversals !
Retweet And Share 🔄
@kuttrapali26 @AmitabhJha3
A thread for Swing and Positional Traders who love Reversals !
Retweet And Share 🔄
@kuttrapali26 @AmitabhJha3
What is Heikin Ashi ?
Go through this Tweet for complete understanding
1/n
Go through this Tweet for complete understanding
https://twitter.com/JayneshKasliwal/status/1463811861053259778?s=20
1/n
Tools used
1. HeikinAshi charts
2. 200 ema (black)for Dynamic support and reversal point
3. 21 ema(red) for trailing stop loss
4. Volumes
5. Your own confirmations and modification
2/n
1. HeikinAshi charts
2. 200 ema (black)for Dynamic support and reversal point
3. 21 ema(red) for trailing stop loss
4. Volumes
5. Your own confirmations and modification
2/n
Strategy:
200 ema is very important line of support on daily time frame .
Most reversals occur on this area of junction and stock further decides its trend from this point
Mostly stock consolidates near this area beore further move
Example : Breakdown Vs Reversal
3/n
200 ema is very important line of support on daily time frame .
Most reversals occur on this area of junction and stock further decides its trend from this point
Mostly stock consolidates near this area beore further move
Example : Breakdown Vs Reversal
3/n


1. Heikin Ashi candle shows the trend of a stock
2. Once we get confirmation of 2 Strong Green candles with full body a long trade can be created upon the closing above 200 ema
3. For further confirmation you can use Volume Spikes ,Macd or Relative Strength for filteration
4/n
2. Once we get confirmation of 2 Strong Green candles with full body a long trade can be created upon the closing above 200 ema
3. For further confirmation you can use Volume Spikes ,Macd or Relative Strength for filteration
4/n

1.200 ema is very important line for support and a stock should be closely watched at that junction .
2 In #bhel we can see how the price bounced back after 2 confirmation green candles.
3. The stock bounced 40% till top before dropping off.
4. Now again approaching 200 ema
5/n
2 In #bhel we can see how the price bounced back after 2 confirmation green candles.
3. The stock bounced 40% till top before dropping off.
4. Now again approaching 200 ema
5/n

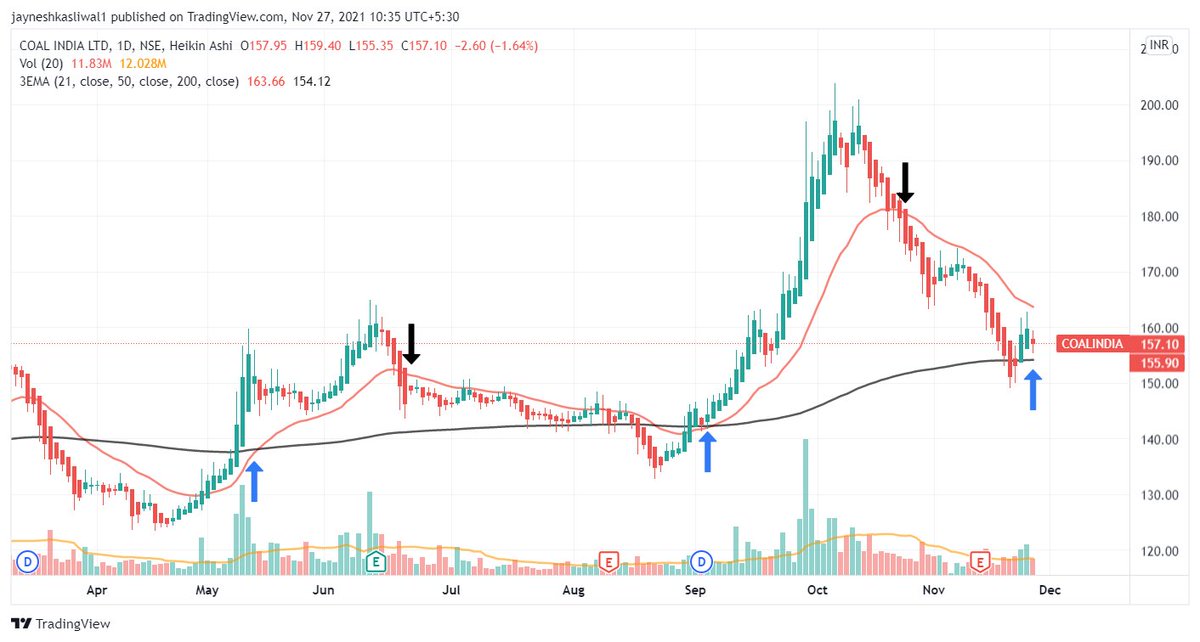
Similar Chart : #coalindia
Fresh Reversals
1. 21 ema can be used as trailing Stop loss in such cases to ride the trend
2. One can use Risk Reward of minimum 1:2 for targets.
3. The Rewards will be very high compared to risk .
4. One can maximum have stop at 8%.
6/n
Fresh Reversals
1. 21 ema can be used as trailing Stop loss in such cases to ride the trend
2. One can use Risk Reward of minimum 1:2 for targets.
3. The Rewards will be very high compared to risk .
4. One can maximum have stop at 8%.
6/n
Fresh Buying and confirmation of reversal:
#piind closed above 200 ema and above support area.
This is a high probabilty setup for buying as we see volume also picking up and Rs is increasing.
You have to modify this with your own strategy and check what suits you.
7/n
#piind closed above 200 ema and above support area.
This is a high probabilty setup for buying as we see volume also picking up and Rs is increasing.
You have to modify this with your own strategy and check what suits you.
7/n

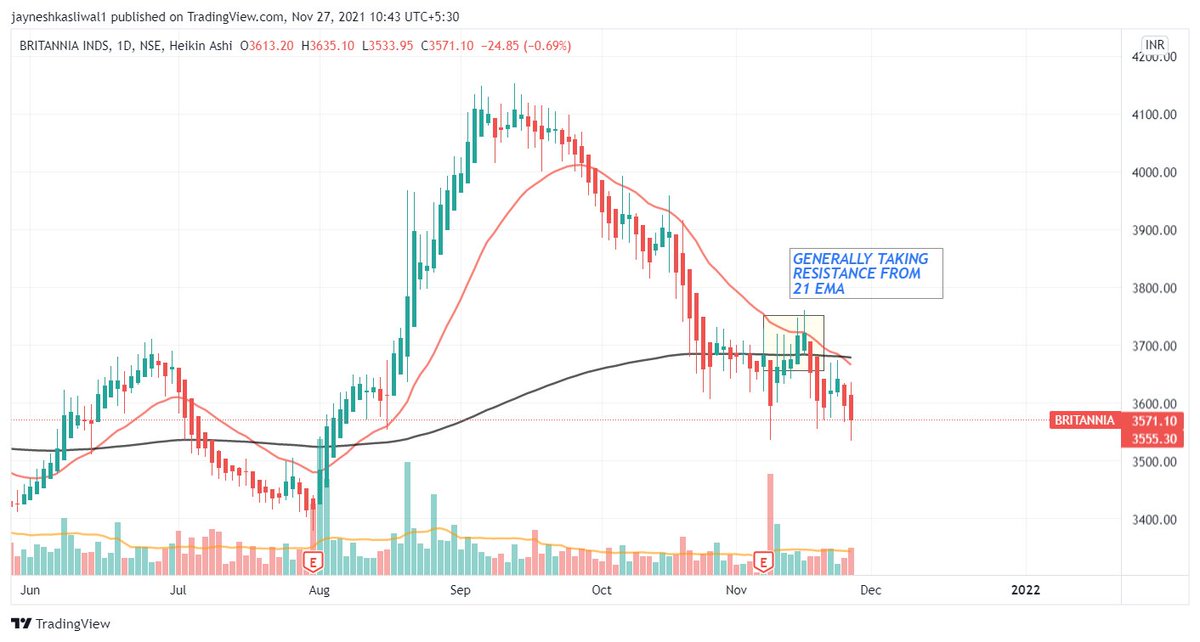
21 ema resistance :
Sometimes if the 21 ema is close to 200 ema and stock is bouncing you need to get confirmation closeabove 21 ema for safety .
Many times stocks will take resistance at this are and fall again.
Best confirmation is volume spikes above 200 ema
Examples :
8/n
Sometimes if the 21 ema is close to 200 ema and stock is bouncing you need to get confirmation closeabove 21 ema for safety .
Many times stocks will take resistance at this are and fall again.
Best confirmation is volume spikes above 200 ema
Examples :
8/n


Potential Buy #LAURUS #NILKAMAL #THYROCARE Obviously after confirmation .
#Laurus and #nilkmal looks good for fresh upsde as they both held well in falling market
9/n
#Laurus and #nilkmal looks good for fresh upsde as they both held well in falling market
9/n


Screener To find such stocks that have given heikinashi close above 200 ema. chartink.com/screener/200-e…
Modify this by putting more filters according to your own rules !
#stocks
@caniravkaria @Stockstudy8
Modify this by putting more filters according to your own rules !
#stocks
@caniravkaria @Stockstudy8
To join our private group for free
app.cosmofeed.com/view_group/618…
To join free telegram group
t.me/Techno_charts
app.cosmofeed.com/view_group/618…
To join free telegram group
t.me/Techno_charts
• • •
Missing some Tweet in this thread? You can try to
force a refresh


