Consumer prices rose 0.8% in November, and were up 6.8% from a year earlier. That's the fastest year-over-year rate of inflation in 39 years.
Excluding food and energy, prices were up 0.5% from October and 4.9% from a year earlier.
nytimes.com/live/2021/12/1…
Overall consumer prices rose 6.8% in November from a year ago. That's the fastest rate of inflation since June 1982. Helpful to see this in some historical perspective, however:
On a month-to-month basis, price gains cooled slightly in November (+0.8%, vs +0.9% in October). But we're not seeing the quick return to normal that many forecasters were expecting just a few months ago. (Of course, that's true for many things in the economy right now.)
Earlier this year, the year-over-year rate of inflation was misleading because it reflected "base effects" -- price declines early in the pandemic led to inflated readings a year later. But that effect is fading as we get further away from the spring distortions.
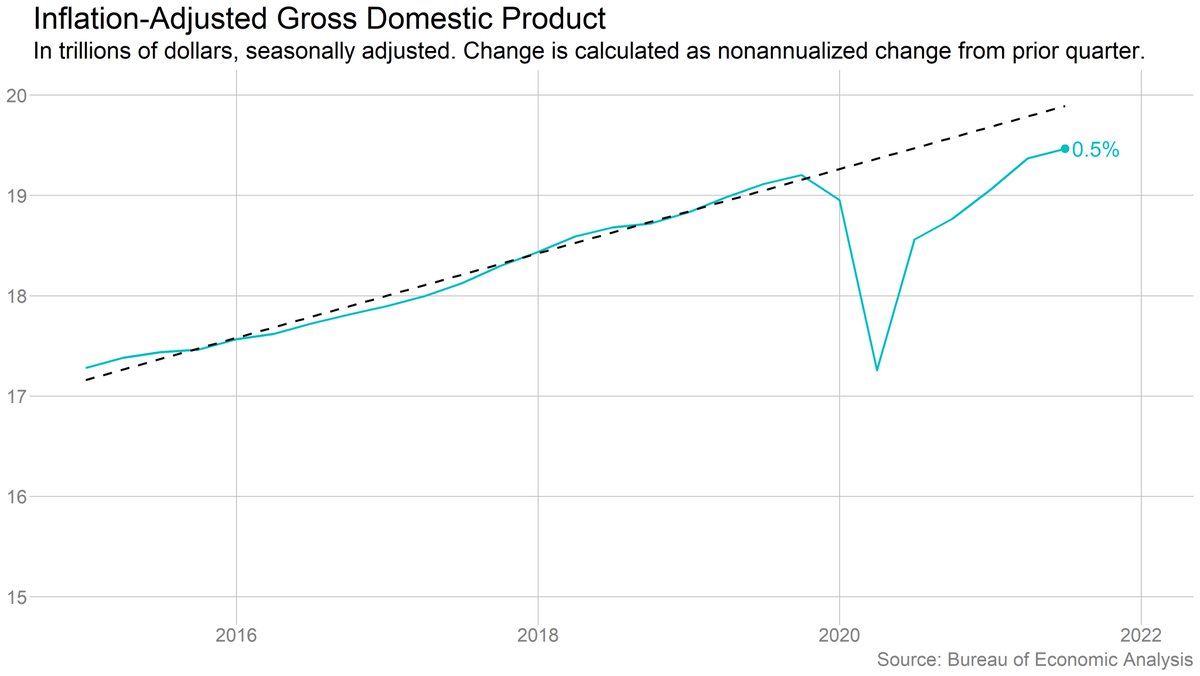
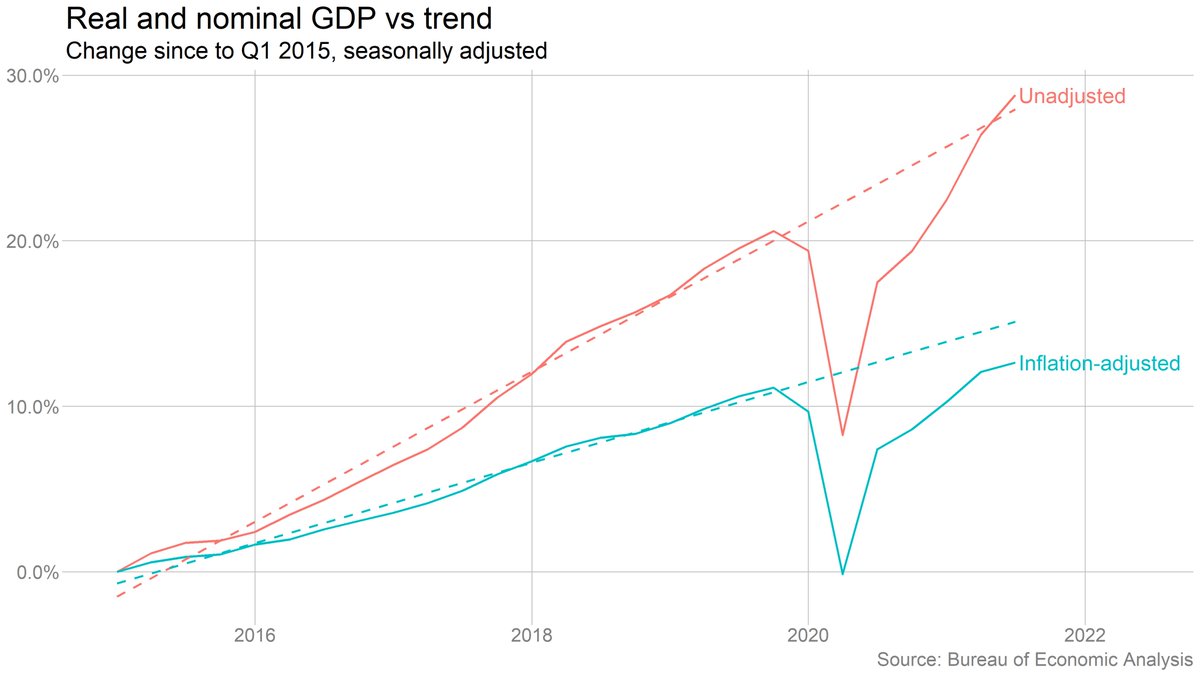
Another way to see this is to look at the price *level* rather than the rate of change. You can clearly see that prices quickly caught up to their pre-Covid trend, and have now far surpassed it.
Some people have suggested looking at the two-year change instead of the one-year as a way to account for base effects. I'm not a fan of this approach, as it by definition mutes whatever signal we're seeing in the latest data. But here's that chart as well:
Inflation is wiping out wage gains. Real average hourly earnings fell in November on both a month-to-month and year-to-year basis.
But for the lowest-paid workers, wage gains ARE keeping up with inflation. Leisure and hospitality workers in particular have seen substantial earnings increases even after adjusting for inflation.
It's worth looking at wage levels as well. Overall average hourly earnings have now fallen below their pre-pandemic trend after adjusting for inflation, and even in leisure and hospitality, earnings are basically at their prepandemic trend.
Important note: These hourly earnings measures are tricky to interpret. They're overall averages, which can be skewed by the shifting patterns of people entering/leaving the workforce during the pandemic. We get better data that adjusts for these changes, but only quarterly.
(Picking back up this thread after a delay for a phone call.)
Gas prices were once again a big driver of the overall CPI in November -- up 6.1% for the second straight month, and up 58% from a year earlier.
But the good news is that oil prices have fallen significantly since late October, and gas prices have already begun to edge down.
Home heating prices were also way up in November, but as @talmonsmith notes, falling natural gas prices are good news heading into winter:
nytimes.com/2021/12/07/bus…
Food prices are also still rising quickly, especially for meat. Ground beef up 14% y/y in November. Pork up 17%. Chicken up 9%.
Rents are rising more slowly than overall inflation, but rental price gains are accelerating. That's a big worry for the Fed, because rents are a huge part of CPI, and the trend is unlikely to reverse quickly once it gets started.
Similar story on "owner's equivalent rent," the CPI's hard-to-understand measure of housing costs for homeowners.
Used car prices are on the rise again after falling earlier this fall. Up more than 30% over the past year.
Used cars have been a major driver of overall inflation in the pandemic: Overall CPI is up 7.8% since Feb. 2020. Without used cars, it's up 6.7%.

• • •

Missing some Tweet in this thread? You can try to force a refresh
 

Keep Current with Ben Casselman

Ben Casselman Profile picture

Stay in touch and get notified when new unrolls are available from this author!

Read all threads

This Thread may be Removed Anytime!

PDF

Twitter may remove this content at anytime! Save it as PDF for later use!

Try unrolling a thread yourself!

how to unroll video
  1. Follow @ThreadReaderApp to mention us!

  2. From a Twitter thread mention us with a keyword "unroll"
@threadreaderapp unroll

Practice here first or read more on our help page!

More from @bencasselman

5 Nov
Want a sign that the economy is edging back toward normal? The share of people working from home because of Covid fell to a pandemic low of 11.6% in October. Resumed its decline after stalling out during the Delta wave.
Notable drop in work-from-home among professional workers. Which is a good place to note that I'm tweeting this from the office.
Read 27 tweets
5 Nov
U.S. employers added 531k jobs in October, and the unemployment rate fell to 4.6%.
Full coverage: nytimes.com/2021/11/05/bus…
Labor force grew by just 104k, and the participation rate was unchanged.
September's disappointing number was revised up to +312k. August revised up too. Net gain of 235k from the revisions.
Read 6 tweets
4 Nov
What I teach my students @newmarkjschool is that the data should determine the anecdotes, not the other way on. So if the data says older workers are retiring early, we should go find people retiring early and talk to them about why.
Where possible, we should disaggregate the data -- is the increase in early retirements being driven by college-educated workers? By women? By Black people? There are limits to this in practice, but we should aim to have our anecdotes be as representative as possible.
We should also be clear that even representative anecdotes are still anecdotes. "Real people" in stories provide nuance and color, and can help readers understand a trend. But they aren't evidence of a trend or what is causing it.
Read 6 tweets
29 Oct
Income/spending/inflation data for September:
Personal income (nominal): -1%
Consumer spending (nominal): +0.6%
Consumer prices: +0.3% m/m, +4.4% y/y
Core consumer prices: +0.2% m/m, +3.6% y/y
bea.gov/news/2021/pers…
September Employment Cost Index, *three month* change:
Total compensation: +1.3% (vs 0.7% in June)
Wages and salaries: +1.5% (0.9% June)
Leisure & hosp. wages/salaries: +2.6% (2.8% June)
bls.gov/news.release/e…
The drop in income in September was driven by the end of expanded federal unemployment benefits. Wage and salary income actually rose faster in Sept. than in August.
Read 14 tweets
28 Oct
Economic output grew 0.5% in the third quarter (2% annualized). That's a sharp slowdown from the 1.6% (6.7% annualized) in Q2, as supply chain woes and the rise of the Delta variant constrained growth.
nytimes.com/live/2021/10/2…
U.S. GDP surpassed its prepandemic level in the second quarter, but it's still well below the prepandemic trend.
But inflation is a big part of the story here. Nominal (non-inflation-adjusted) GDP is back on its prepandemic trend. But real (inflation-adjusted) GDP is below. Fits with the story of demand outstripping supply, so some of it ends up as higher prices, not more production.
Read 6 tweets
22 Oct
Lots of new state labor market data today!
State and local employment/unemployment: bls.gov/news.release/j…
State-level JOLTS (new report!!!): bls.gov/news.release/j…
I'm busy with other stories today, so won't be delving into the numbers in depth, at least right away. But a few charts to update my earlier reporting on the impact of cutting off UI benefits.
nytimes.com/2021/08/20/bus…
The short version: Still no evidence that states that cut off benefits early have seen significantly faster job growth than states that kept the benefits. The two groups have seen essentially identical job growth since April.
Read 10 tweets

Did Thread Reader help you today?

Support us! We are indie developers!


This site is made by just two indie developers on a laptop doing marketing, support and development! Read more about the story.

Become a Premium Member ($3/month or $30/year) and get exclusive features!

Become Premium

Too expensive? Make a small donation by buying us coffee ($5) or help with server cost ($10)

Donate via Paypal

Or Donate anonymously using crypto!

Ethereum

0xfe58350B80634f60Fa6Dc149a72b4DFbc17D341E copy

Bitcoin

3ATGMxNzCUFzxpMCHL5sWSt4DVtS8UqXpi copy

Thank you for your support!

Follow Us on Twitter!

:(