NEW thread: data show South Africa’s Omicron wave is resulting in less severe disease and death than past waves, though health officials say it’s too early to be sure, and severe outcomes will continue to climb.
Story by me, @jsphctrl, @mroliverbarnes: ft.com/content/0ee745…
Story by me, @jsphctrl, @mroliverbarnes: ft.com/content/0ee745…

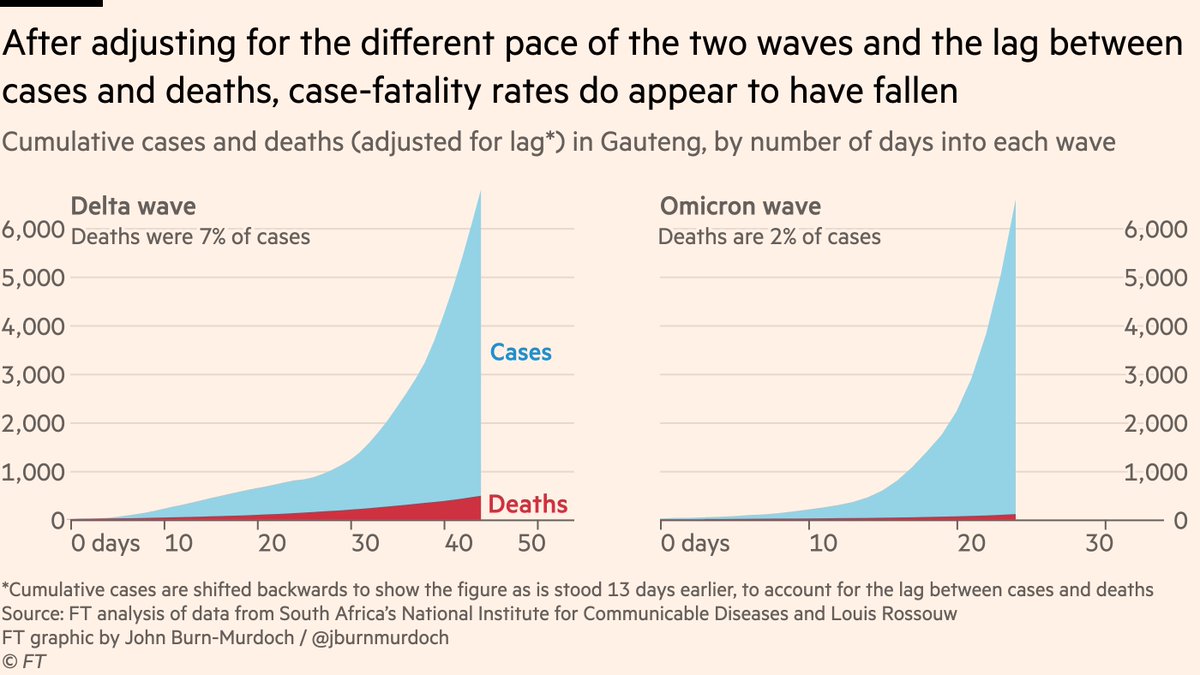
I’ve not adjusted the dates in that chart, so you can see that admissions typically lag cases by several days, and deaths lag by around two weeks.
So Omicron deaths *will continue to rise* but it’s clear that they’re not tracking cases as closely as they did in the Delta wave.
So Omicron deaths *will continue to rise* but it’s clear that they’re not tracking cases as closely as they did in the Delta wave.

Now, we need to be careful here, because not only do deaths lag cases, we also need to note that the rapid rise of Omicron means there have been fewer cases accumulated than at the same stage of the slower-rising Delta wave, so we would expect fewer deaths
https://twitter.com/glbabbington/status/1468545290298822657
To that end, here are *cumulative* cases & deaths rather than daily numbers, and I’ve also shifted cases backwards by 2 weeks, so this is "compared to the number of people who had tested positive by 2 weeks earlier, how many deaths had occurred 13 days on?"
Ratio has reduced 🙏
Ratio has reduced 🙏
An obvious question to ask at this point is: could this not just be due to differences in age profile of cases?
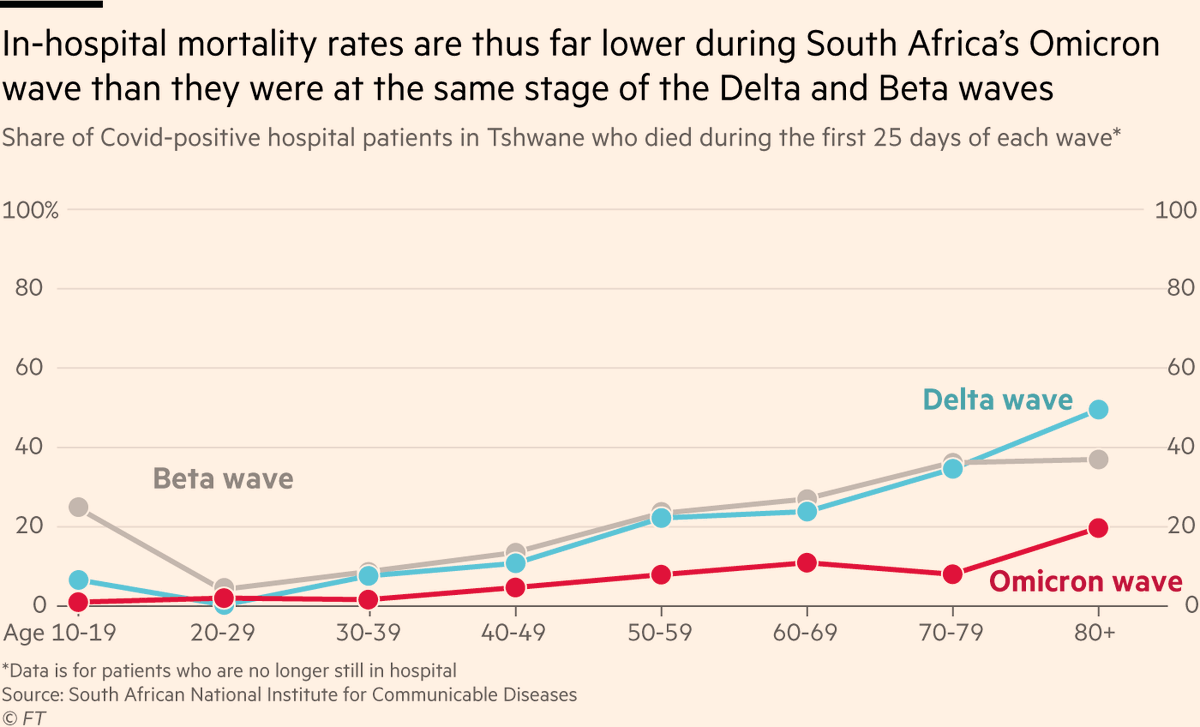
Well, today @nicd_sa published its weekly Covid hospital surveillance report, including wave-vs-wave comparisons of severe disease by age... nicd.ac.za/wp-content/upl…
Well, today @nicd_sa published its weekly Covid hospital surveillance report, including wave-vs-wave comparisons of severe disease by age... nicd.ac.za/wp-content/upl…
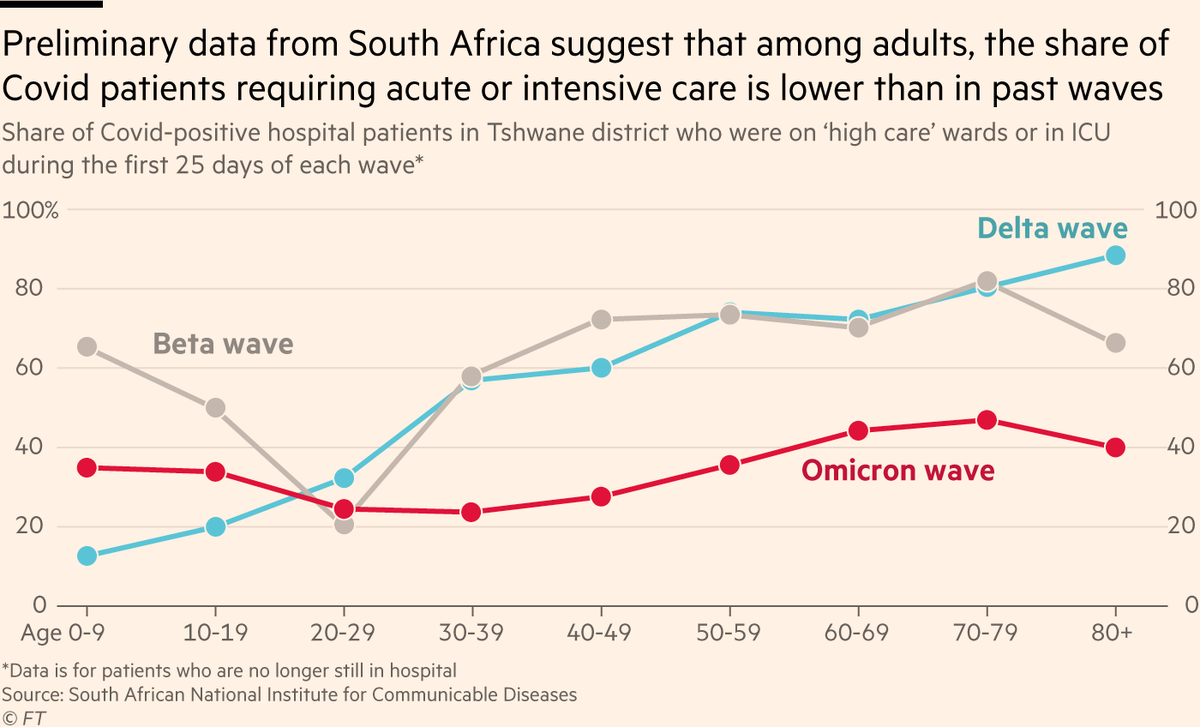
They also published in-hospital mortality by age, which show a similar pattern.
Key point: all of these data are for patients no longer in hospital, so it’s a like-for-like comparison across waves, not biased by Omicron having patients whose outcomes are yet to be determined.
Key point: all of these data are for patients no longer in hospital, so it’s a like-for-like comparison across waves, not biased by Omicron having patients whose outcomes are yet to be determined.
Key caveat
We *are* still early in this wave, and its age profile still skews younger than past waves, so some of the population-wide drop in severe disease will be due to age, and rates may shift upward in coming weeks. But so far, evidence suggests an age-independent drop too.
We *are* still early in this wave, and its age profile still skews younger than past waves, so some of the population-wide drop in severe disease will be due to age, and rates may shift upward in coming weeks. But so far, evidence suggests an age-independent drop too.
And now, I know I keep banging this drum, but the observed drop in rates of severe disease a) does not necessarily mean Omicron is inherently milder than previous variants, because b) ...
A reduction in rates of severe disease and death relative to cases is not a new pattern!
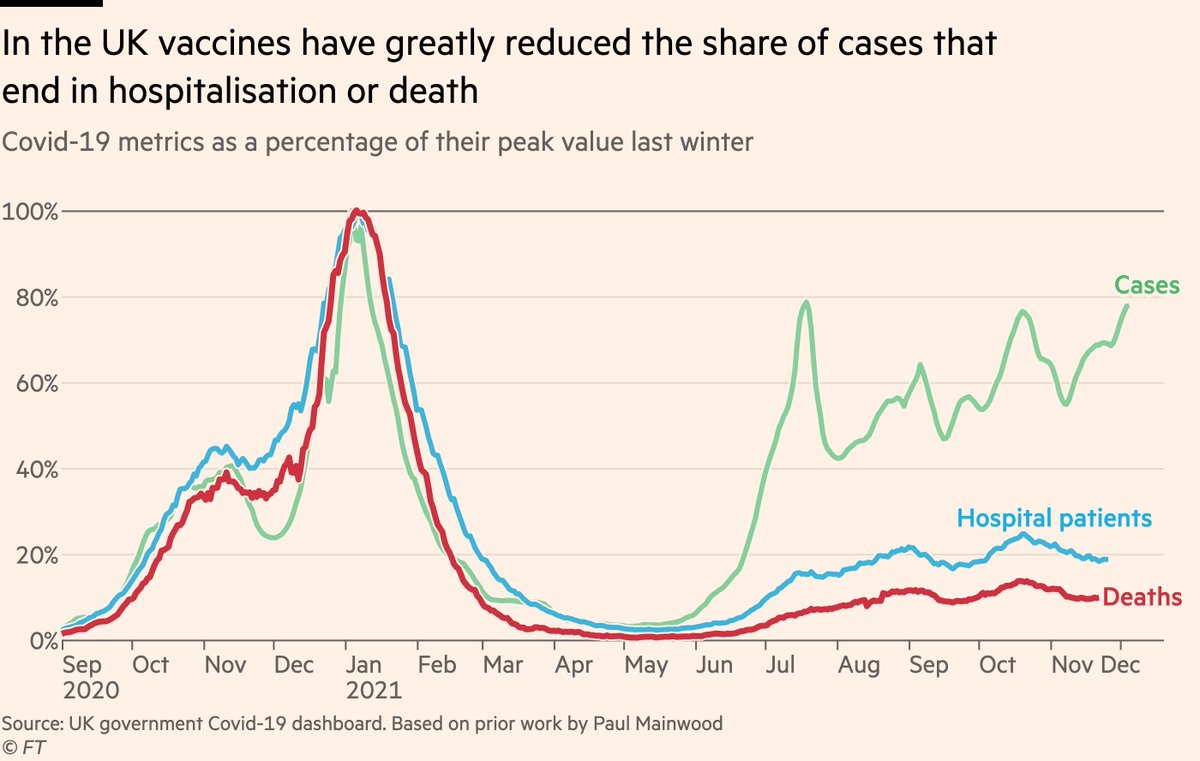
Remember first chart in this thread? Here’s the exact same pattern, but in UK.
Did we say "Delta appears to be milder"? Nope. What changed was levels of immunity, here mostly via vaccines.
Remember first chart in this thread? Here’s the exact same pattern, but in UK.
Did we say "Delta appears to be milder"? Nope. What changed was levels of immunity, here mostly via vaccines.
On a related note, @nataliexdean has a magnificent visual explainer here showing how a new variant like Omicron — one that can evade some of our antibodies and cause reinfections/breakthrough cases — can appear less virulent even if it isn’t
https://twitter.com/nataliexdean/status/1468988174693289994
Point being, what we’re seeing with Omicron may be best understood not as: "this variant makes you less sick", but as "loads of people who would not have been infected at all with other variants, are now getting mild infections [which pushes the severe shares of cases down]".
And that frame of understanding demonstrates why Omicron is still a serious concern:
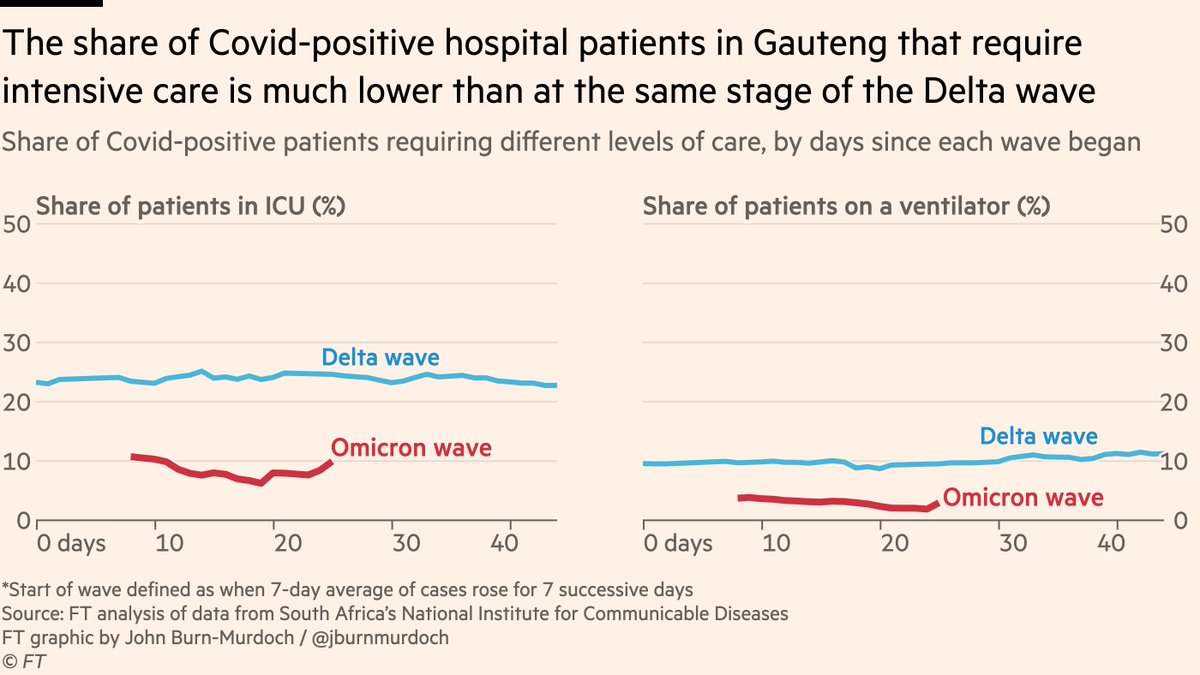
Lots of people *are* still getting very sick in South Africa, it’s just that they’re being drowned out in the stats by the deluge of mild cases among those with prior infection or vaccination.
Lots of people *are* still getting very sick in South Africa, it’s just that they’re being drowned out in the stats by the deluge of mild cases among those with prior infection or vaccination.

And because of the lag between cases and severe disease, those ICU and ventilator lines will continue to climb towards Delta levels even if the Omicron wave were to go into reverse tomorrow.
But speaking of the Omicron wave, I’ll end today’s update with a glimmer of optimism, via the invaluable @lrossouw:
There are tentative signs that new cases in Gauteng may be flattening, and Tshwane — where Omicron first took off — *may* even have peaked
There are tentative signs that new cases in Gauteng may be flattening, and Tshwane — where Omicron first took off — *may* even have peaked
https://twitter.com/lrossouw/status/1469081889151541254
So, finishing back where we started:
If cases in Gauteng are close to peaking, then the question is how high will that red deaths line will climb in the next 2-3 weeks as the lag works its way through. I don’t see it getting near the 100% mark (Delta peak deaths).
If cases in Gauteng are close to peaking, then the question is how high will that red deaths line will climb in the next 2-3 weeks as the lag works its way through. I don’t see it getting near the 100% mark (Delta peak deaths).

Conclusions
• Rate of Omicron cases resulting in severe disease is lower than past waves
• But this is due in large part to dilution of that ratio due to mild cases in vaxxed & recovered
• Numbers with severe disease are lower than past waves but rising, and will keep climbing
• Rate of Omicron cases resulting in severe disease is lower than past waves
• But this is due in large part to dilution of that ratio due to mild cases in vaxxed & recovered
• Numbers with severe disease are lower than past waves but rising, and will keep climbing
As always, please let me know if there are things I’m missing here, if there’s additional data you want to see, if you have additional data I’ve missed etc.
We’ll be back on Twitter Spaces next Weds to bring you the latest developments and answer your questions.
We’ll be back on Twitter Spaces next Weds to bring you the latest developments and answer your questions.
Finally I’ll repeat that we owe an immense debt of gratitude to researchers, epidemiologists, public health officials and doctors in South Africa who continue to share timely, invaluable data and insights that leave other countries far better prepared for their own Omicron waves.
Addendum: excellent illustration here from @enn_nafnlaus of how, in a faster wave like Omicron, the lag between cases & deaths effectively grows, making it even more vital to remember that numbers for severe disease will keep climbing for some time yet
https://twitter.com/enn_nafnlaus/status/1465713586492174341
• • •
Missing some Tweet in this thread? You can try to
force a refresh