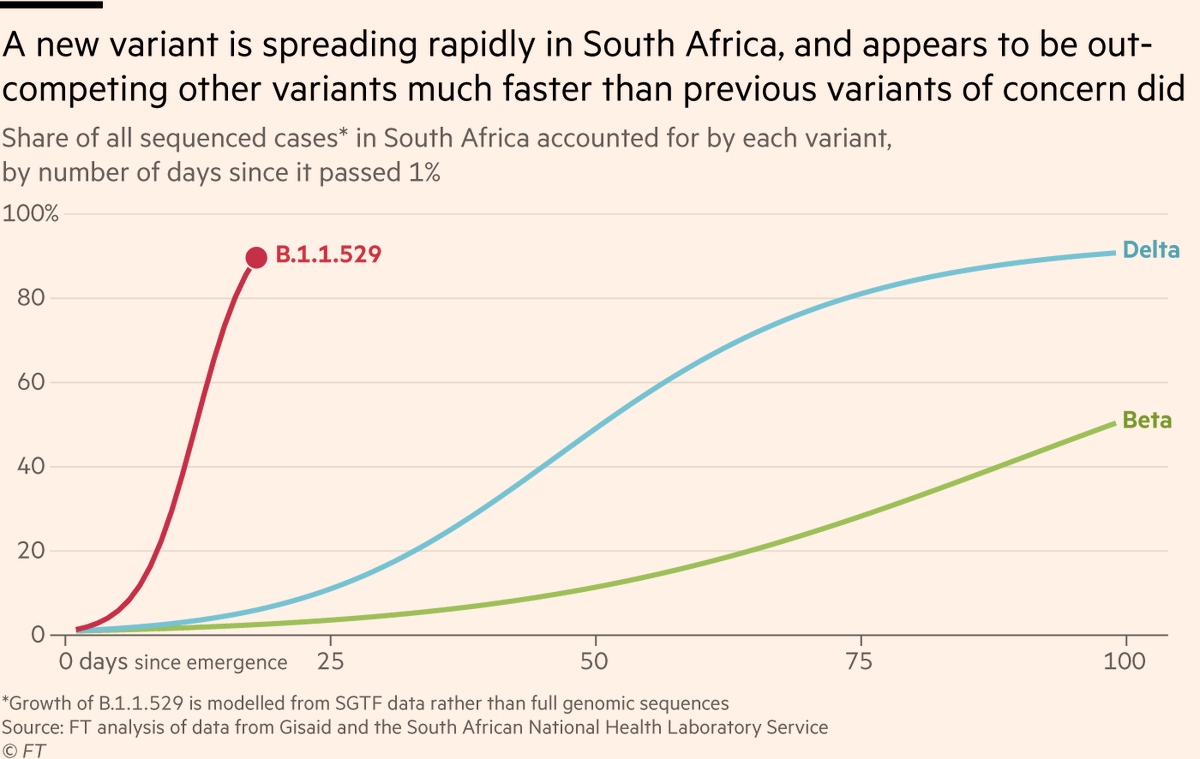
I think we may need to recalibrate our idea of typical case numbers as Omicron takes off.

Here’s what UK cases could look like *in the next week or two alone* if Omicron continues to double every 3 days (some actually estimate faster growth)

Story: ft.com/content/2b309e…
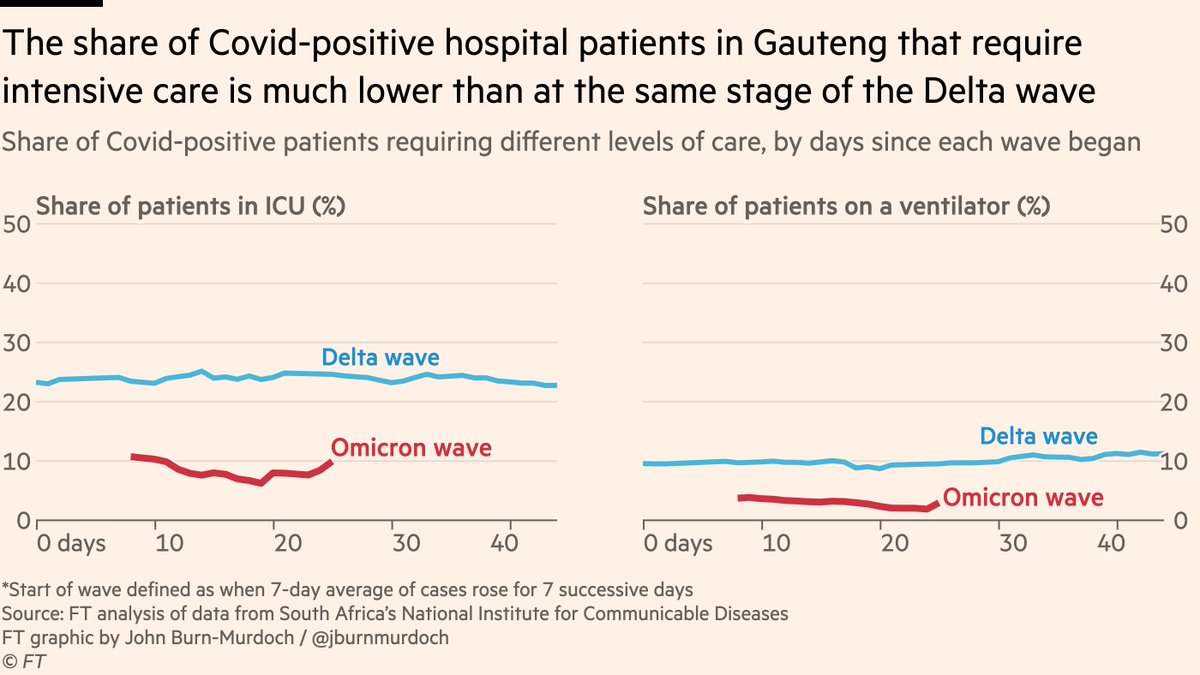
When cases start surging, it will be more important than ever to use the right data to track the extent of severe disease.

I’ll be using this chart: the total number of people in critical-care beds *for any reason, not just Covid*.

It’s excess deaths, but for hospital pressure.
(you may recognise that from this animated version last year, which comprehensively debunked the myth that "hOsPiTaLs ArE aLwAyS fUlL aT wInTeR")
The data from the dashboard on Covid-positive hospital admissions and patient numbers obviously remains very useful, but "excess critical care patients" comes into its own with Omicron where the number of patients in hospital *with Covid* but not *for Covid* is likely to rise.
The metric we have always been most concerned about is pressure on the NHS, and this chart tracks exactly that.
What we’re holding out hope for is that England’s 'immunity wall' — HT @DevanSinha — will hold up well, and that the share of cases ending up in hospital or worse will be kept low.

Exactly how low will be critical.

• • •

Missing some Tweet in this thread? You can try to force a refresh
 

Keep Current with John Burn-Murdoch

John Burn-Murdoch Profile picture

Stay in touch and get notified when new unrolls are available from this author!

Read all threads

This Thread may be Removed Anytime!

PDF

Twitter may remove this content at anytime! Save it as PDF for later use!

Try unrolling a thread yourself!

how to unroll video
  1. Follow @ThreadReaderApp to mention us!

  2. From a Twitter thread mention us with a keyword "unroll"
@threadreaderapp unroll

Practice here first or read more on our help page!

More from @jburnmurdoch

10 Dec
NEW thread: data show South Africa’s Omicron wave is resulting in less severe disease and death than past waves, though health officials say it’s too early to be sure, and severe outcomes will continue to climb.

Story by me, @jsphctrl, @mroliverbarnes: ft.com/content/0ee745…
I’ve not adjusted the dates in that chart, so you can see that admissions typically lag cases by several days, and deaths lag by around two weeks.

So Omicron deaths *will continue to rise* but it’s clear that they’re not tracking cases as closely as they did in the Delta wave.
Now, we need to be careful here, because not only do deaths lag cases, we also need to note that the rapid rise of Omicron means there have been fewer cases accumulated than at the same stage of the slower-rising Delta wave, so we would expect fewer deaths
Read 19 tweets
7 Dec
Okay folks, still lot of uncertainty around severity of disease, but here’s what I’ve gleaned from latest data and many chats that @mroliverbarnes and I have had with the brilliant, tireless doctors & public health officials in South Africa ft.com/content/d315be…

Thread follows
Newest stuff first:

Data from @nicd_sa show that in Gauteng province, the share of Covid-positive patients in ICU or on ventilators is somewhere between 2-3x lower than it was at the same stage of the Delta wave 🤞 Image
This suggests a reduction in severity of outcomes, and we see something similar when we look at length of stay in hospital:

@nicd_sa gave me data today on admissions & discharges, and it’s clear that the gap between the two is shorter for this wave, suggesting milder illness 🤞 Image
Read 22 tweets
4 Dec
Okay folks, time for a South Africa update, focused this time on severity of disease.

First up, the report from hospitals in Tshwane (the district furthest along in Omicron wave) is essential reading, as is thread from @miamalan samrc.ac.za/news/tshwane-d…
If/when you’ve read those, you’ll understand why I didn’t open this thread with the charts showing exponential rise in cases, test positivity & admissions, which I believe risk oversimplifying the much more nuanced picture set out in the Tshwane report.
The charts I’m now going to show are a direct response to the Tshwane report. I don’t believe any of these contradict what the report discusses, but I think they help to contextualise it and think about where things are headed.
Read 20 tweets
2 Dec
NEW: today’s update from Gauteng, now on a log scale to better show current trajectories.

Steepness of lines shows how much faster the growth in cases and positivity is now vs past waves, and hospital admissions are now steepening too as the acceleration in cases feeds through.
Here’s same thing back on linear scale.

The eagle-eyed among you may spot something here: hospital admissions were tracking the Beta wave and first wave in yesterday’s chart, but today they’re slightly steeper. How is that possible, since it still shows data for the same dates?
This is why:

South Africa’s weekly hospital admission counts are back-filled every day as new patient data comes in, so the figure for the week ending Nov 28 has been rising in recent days, from 580 in the data published on the 29th, to 788 in today’s report.
Read 10 tweets
30 Nov
NEW: we know cases rising fast in South Africa, but what about severe outcomes?

I spent yesterday pulling together hospitalisations for Gauteng province, so we can compare the fledging Omicron wave to those that preceded it.

So far admissions following ~same path as past waves.
Quick notes (1/2):
• For cases to be rising faster while admissions are on same pace may hint at a lower proportion of severe disease
• But this may also simply be the result of more infection-acquired immunity and vax
• Or of cases so far being predominantly younger people
And 2/2:
• Share of patients in ICU currently much lower than same stage of Delta wave, but may change if cases spread from being mainly young. Or may not, which would suggest T and B cells kicking in 🤞
• Please follow people on the ground incl @Tuliodna @tomtom_m @rjlessells
Read 6 tweets
25 Nov
Five quick tweets on the new variant B.1.1.529

Caveat first: data here is *very* preliminary, so everything could change. Nonetheless, better safe than sorry.

1) Based on the data we have, this variant is out-competing others *far* faster than Beta and even Delta did 🚩🚩
2) This is coinciding with a wider rise in cases in South Africa.

Again, currently we’re talking about small numbers (both of B.1.1.529 and of cases in SA overall), but there’s a clear upward trend. This may be a blip, but this is how waves start.
3) Aside from its rapid rise in South Africa, the other key reason for concern here is that the specific mutations that B.1.1.529 has are — based on what we’ve seen with other variants — known to be associated with greater transmissibility & immune evasion
Read 9 tweets

Did Thread Reader help you today?

Support us! We are indie developers!


This site is made by just two indie developers on a laptop doing marketing, support and development! Read more about the story.

Become a Premium Member ($3/month or $30/year) and get exclusive features!

Become Premium

Too expensive? Make a small donation by buying us coffee ($5) or help with server cost ($10)

Donate via Paypal

Or Donate anonymously using crypto!

Ethereum

0xfe58350B80634f60Fa6Dc149a72b4DFbc17D341E copy

Bitcoin

3ATGMxNzCUFzxpMCHL5sWSt4DVtS8UqXpi copy

Thank you for your support!

Follow Us on Twitter!

:(