
Jim is a very vixperienced investor, who surely has the answers himself. But I'll bite anyway, so here goes.🧵
https://twitter.com/vixologist/status/1474470649036955653
There can be no single indicator to time a $VIX or $SPX trade. Even if it were, some machine would have by now already learned how to front-run it. So I'm the last person to suggest there is a publicly available indicator that one may have identified
but everybody else hasn’t. The collective intelligence of the market is the aggregate, not the average. But to answer @vixologist's question, a favorite I always look out to is correlations and vol-of-vol. But that’s just us, and even more so, largely as a signal that triggers
risk-off environment for our core short vol exposure. The @CBOE universe of indices can be a common point of reference for a conversation, but their limitations put a cap to any simplistic method such as i.e. $VVIX < 90 means $VIX is cheap. In the equity volatility universe
low does not necessarily mean cheap. And it gets knottier. One might indeed explore correlations, and vol-of-vol, and skew, and convexity, and whatever. But this brings up the question: Which correlation? Which vol? Which skew?
These all have 3-D features, whose proper assumptions and calibration is the holy grail even for people with gargantuan footprint in the volatility market. And there are 4-5 users in #voltwit who literally wrote the book. Literally. (...Plus the gent with the terra water bill).
The $VVIX you are looking at today will not be the same tomorrow, you need a different basket of options to replicate it, in different size. Voltwit has been through this hundreds of times. $SKEW … $VIX … $OVX … $GVX ... they’re all just numbers to use as reference.
You can trade skew, but you cannot trade the SKEW Index. You can trade the S&P500 index volatility, but you cannot trade the $VIX. Which brings us to clarifying what exactly is it you trade? What's the source of P/L of a position? Tremendously wide meaning in volatility trading.
Considering volatility as quadratic variation of returns, all paths have the same volatility. But equating volatility to standard deviation of the terminal log price implies that a mean-reverting path Up-Down-Up-Down is more volatile than a trending path Up-Up-Up.
Depending on your delta-hedging tactic, vega and gamma can be more critical along the mean-reverting path than the trending path. To make things more complex, it’s a totally different trade to harvest the $VIX term-structure rolldown, compared to selling $SPX volatility where you
monetize some lower realized volatility in arrears, or versus buying $VXX to benefit from implied being quoted higher in the next few days. Thus VIX at 0.8x of VIX3M may really indicate this ratio is soon edging higher, but it can be that $VIX spiked, or VIX3M dipped, or whatever
You really cannot capitalize on that specific factor; there’s some other basis risk you will be harvesting, either knowingly or not, and you gotta identify what that is, else it's a time-bomb and you are up for a very surprising wake-up call. ("F**k, that was a 6sigma event")!
This doesn’t mean that signaling indicators are not useful. Rule-based, systematic trading offers a methodical and orderly approach to investing. And if I were to offer some input in the OP discussion on practical signals, I will again come back to Vol-of-vol and correlations.
A vol-of-vol premium exists. Even if not into systematically harvesting that, the $VVIX can be a starting point to derive with a number indicating rich/cheap vol. But only in combination with some other data and mostly as a signal that some extreme may soon revert to its mean. 

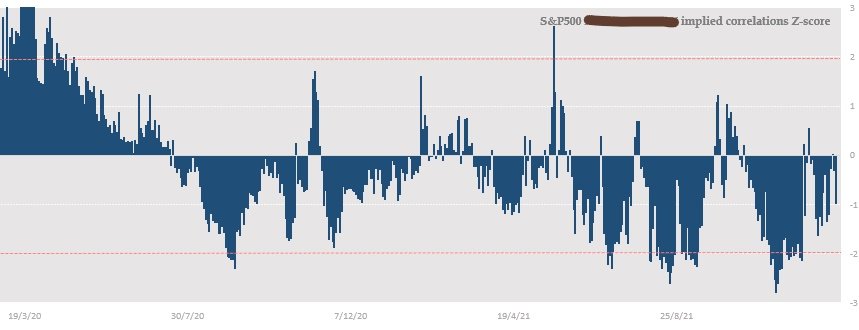
Evidently, any index vol trader considers correlations paramount to her trading. Eye $SPX correlations like a hawk. Most prominently, for us, it may signal downsizing of our systematic rolling short vol exposure when z-score is below -2σ (or something across these lines).
Again it comes down to two distinct approaches to trade volatility. One is theoretically overall impartial, probably trading listed products of the $VIX complex whenever it considers VIX low/high. The other is somewhat systematic and orderly, most likely constantly
invested the market, looking to fine-tune the portfolio as time progresses. The first method is for a forecaster. And I understand the original question is targeting audience following that method. But the second method is more for a “nowcaster”.
I’m a nowcaster, managing my position day-by-day as new data come out or as the volatility surface changes shape. Most often, a core position would involve short variance swap replications through listed options. We distribute the vega notional daily, i.e. 1Month = 1/22 per day.
So it’s never actually frenetic trading and the signals we look out for are indicators to heighten/lower the size of vega bps we periodically roll. That said, for higher frequency trades, tail-risk hedges, committed long vol accounts, relative-value trades, etc ...
there’s another layer adding complexity to simplistic indicators: Coping with the shortcomings of the Black-Scholes model. Enter spot-vol covariance. Spot and vol are not independent and most of the errors experienced in mainstream hedges may be attributed to vanna (and volga).
Probably a very wide level of proficiency following us, not sure how deep to dive. My tweets are just stray thoughts I came up with during Boxing Day. As an epilogue: what we all share here is toy models with extreme simplifications. Every now and then, they would be
just OK as naïve indicators. Do not assign too much weight to these. Do not believe you read between the lines and you are up to something, and please do not ever base your trades on something you read on #voltwit.
• • •
Missing some Tweet in this thread? You can try to
force a refresh


