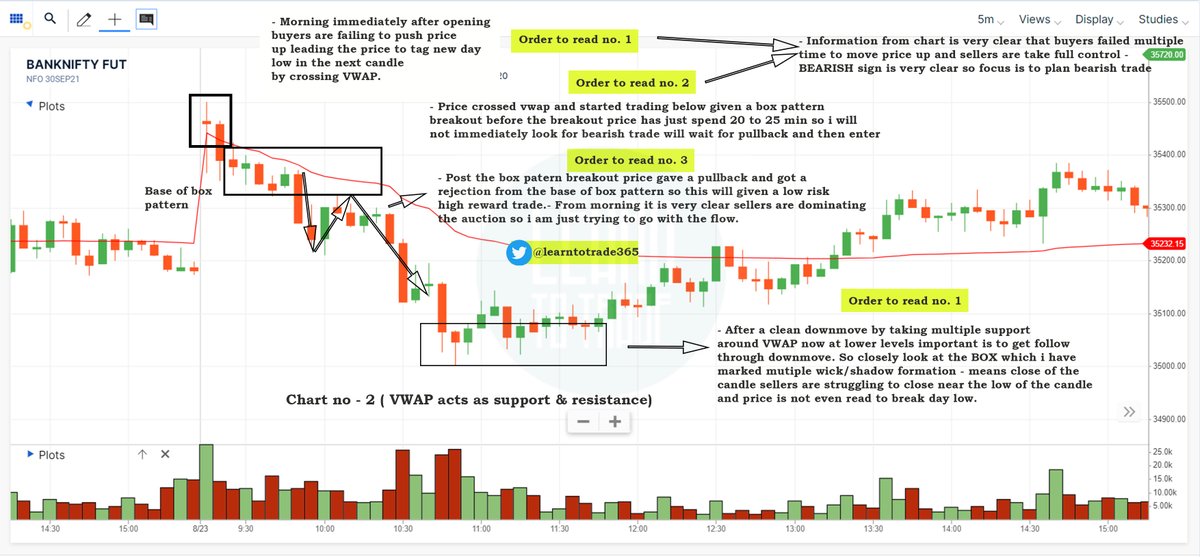
Here is the Key Learning takeaway from yesterday's Twitter space @chartmojo @sunilgurjar01 and team
Topic - Breakout trading strategy
Watch the video for learning -
Also read the Twitter thread 🧵
#StockMarketindia #stockmarkets #trading
Topic - Breakout trading strategy
Watch the video for learning -
Also read the Twitter thread 🧵
#StockMarketindia #stockmarkets #trading
https://twitter.com/learntotrade365/status/1477513140258545666
ATH ( All time high ) BREAKOUT
- Check Higher High formation
- Find stocks consolidating at ATH before breakout
- Consolidation before breakout removes weaker hand traders
Chart Example - Monte Carlo , PIX Transmission ( weekly chart )
Video -
- Check Higher High formation
- Find stocks consolidating at ATH before breakout
- Consolidation before breakout removes weaker hand traders
Chart Example - Monte Carlo , PIX Transmission ( weekly chart )
Video -
52 week High Breakout
- Again check for consolidation before breakout
- During the consolidation phase we can find any chart pattern or Continuous pattern (i.e Ascending triangle , Rectangle/box pattern etc...)
- Pattern creates conviction.
- Again check for consolidation before breakout
- During the consolidation phase we can find any chart pattern or Continuous pattern (i.e Ascending triangle , Rectangle/box pattern etc...)
- Pattern creates conviction.
Moving Average Breakout
- Now will focus about reversal pattern
- Stock getting a decent correction 20 to 25% from 52 week/ATH HIGH . Confirm the reversal pattern (Double or triple bottom formation + price crossing it's 20 & 50 DMA is a plus sign )
Chart example Balrampur chini
- Now will focus about reversal pattern
- Stock getting a decent correction 20 to 25% from 52 week/ATH HIGH . Confirm the reversal pattern (Double or triple bottom formation + price crossing it's 20 & 50 DMA is a plus sign )
Chart example Balrampur chini
VCP PATTERN
- SOMANY CERAMICS , RAJESH EXPORT.
- The pattern develop skews formation to remove weak hands
- Check the volume ( Strong volume during VCP breakout means SMART MONEY , If volume is lagging during vcp breakout means more retail traders )
- SOMANY CERAMICS , RAJESH EXPORT.
- The pattern develop skews formation to remove weak hands
- Check the volume ( Strong volume during VCP breakout means SMART MONEY , If volume is lagging during vcp breakout means more retail traders )
DARVAX BOX
- Formation of Rectangle / Box pattern
- Basically it is a Continuous pattern
Chart Example - SOMANY CERAMICS
- Formation of Rectangle / Box pattern
- Basically it is a Continuous pattern
Chart Example - SOMANY CERAMICS
Find stocks which is closer to 52 week or ATH HIGH in a range of 5 to 10 %
- Look for consolidation before breakout
- Check volumes on breakout ( Good volume is better )
- Identify Continuous pattern during the consolidation phase
- ADANI ENT
- ASTRAL
- POWER GRID
-TIMKEN
- Look for consolidation before breakout
- Check volumes on breakout ( Good volume is better )
- Identify Continuous pattern during the consolidation phase
- ADANI ENT
- ASTRAL
- POWER GRID
-TIMKEN
Continuous Chart Pattern
- Ascending Triangle
- Rectangle /Box Pattern etc...
Reversal Pattern
- Double or Triple bottom
-Rounding bottom
- Ascending Triangle
- Rectangle /Box Pattern etc...
Reversal Pattern
- Double or Triple bottom
-Rounding bottom
Develop a Habit to cut your losses earlier
and ride the winning trades
Develop a exit strategy based on your trading style and ride the winning trades until your exit
strategy
Profit should not be a reason to exit trades
Watch the video -
and ride the winning trades
Develop a exit strategy based on your trading style and ride the winning trades until your exit
strategy
Profit should not be a reason to exit trades
Watch the video -
• • •
Missing some Tweet in this thread? You can try to
force a refresh


