
An animation showing the current #SaharaWaterTransport #MiddleEast #ExtremeWeather event over its full terrestrial area and timescale from 17th December till today.
Daily rain intensity measures show where rain fell each day.
Daily rain intensity measures show where rain fell each day.
1. Along the bottom the monsoon atmospheric river moves West.
2. Over the Atlantic storms produce atmospheric moisture.
3. This travels ENE over the Sahara to the Middle East
[Src. New animation service on @Nasa #Worldview.]
2. Over the Atlantic storms produce atmospheric moisture.
3. This travels ENE over the Sahara to the Middle East
[Src. New animation service on @Nasa #Worldview.]
@NASA This animation looks at the next segment in water transport - same time period - over the Indian Ocean and Eurasia to China. Again the monsoon is moving in the opposite direction.
It is remarkably how shallow the angle is of the atmospheric rivers which are moving ENE.
It is remarkably how shallow the angle is of the atmospheric rivers which are moving ENE.
This second animation is the reason for this thread, as I wanted to see what the cascading effects of what we are seeing in the middle east are over India China and the West Pacific. And as you can see they are significant.
Each frame as you can see is a single day.
Each frame as you can see is a single day.
The next series of animations [Src. @zoom_earth] looks more closely at the period from 1st Jan to 6th Jan at the Himalayas leg of the water transport route - and the mechanisms involved.
The West & East African, and Indian Ocean Monsoons add to the flows as they progress East.
The West & East African, and Indian Ocean Monsoons add to the flows as they progress East.
In particular I was examining the growth of this large cloud area eastwards over China and the West Pacific. These high res. satellite images [Src. @Nasa #Worldview] show the period from the 2nd to the 5th of January 


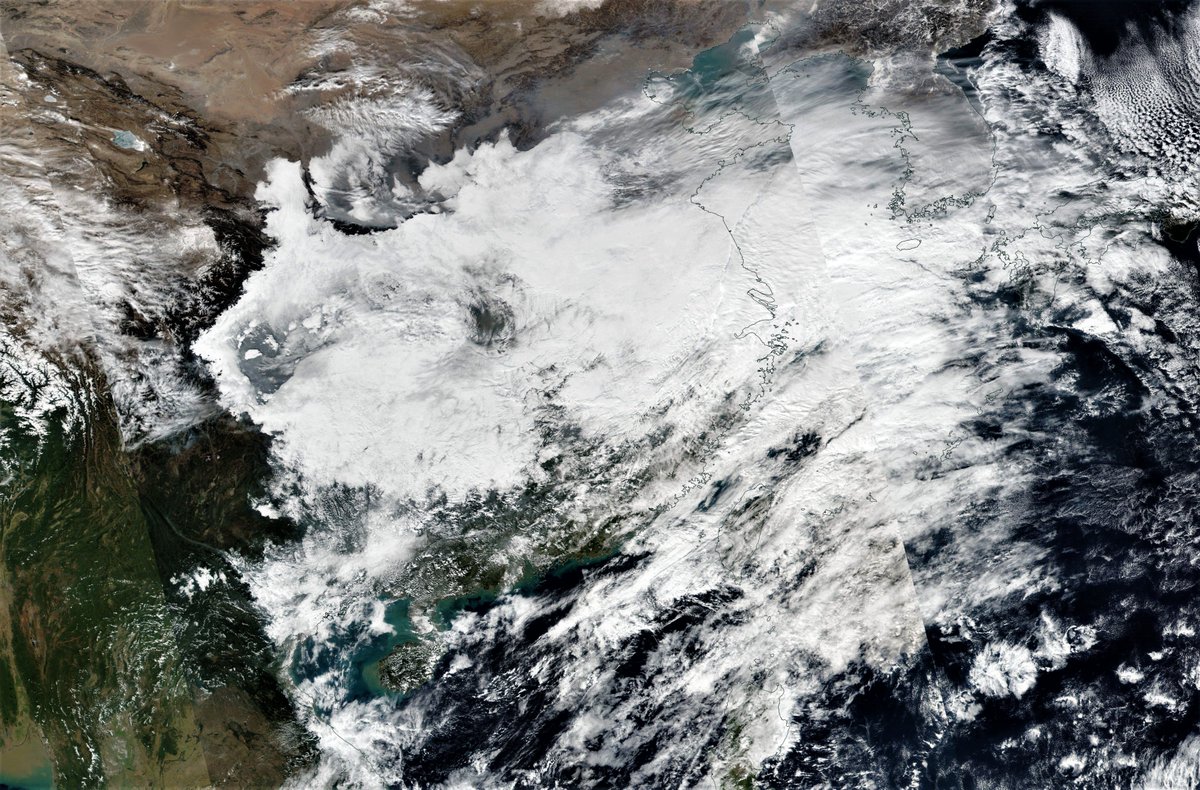
Towards the end of the period, on the 4th and 5th we can now see weather radar traces of storm activity in this cloud mass which covers most of China - and now extends out over the West Pacific.
This integrated water vapour transport animation shows the last 72 hours, incl. the final phases of the Middle East #extremeweather event which I have been monitoring fairly closely since early December.
This series of animations covers the far eastern end of this process, each animation shows 24 hours, beginning on the night of the 1st of January.
Here we see the night of the 2nd of January into the third, and significant growth in the cloud mass. We cab also see a flow of moisture north east out of the Bay of Bengal which is contributing to the buildup over China.
In this PWAT anomaly animation 4-6 January we can more easily visibly see where anomalous levels of atmospheric water are building up. Notably in Northern India.
At the beginning we see the Baluchistan flood event. & at the end, a build up of water over Eastern China
At the beginning we see the Baluchistan flood event. & at the end, a build up of water over Eastern China
Here on the night of the 4th and the 5th of Jan we see a burst of storm activity which appears to be connected to a flow coming north from the monsoon over Myanmar out of the bay of Indian Ocean.
This 177 hour PWAT model forecast of the North Indian Ocean runs from the 4th through to the 13th of January. It shows the atmospheric river which had been over the Arabian Peninsular moving over the Indian subcontinent like a firehose.
And here is the corresponding accumulating rain forecast for the same 7 day period.
And here is the 4th in this series of animations and gets us up to date today. This animation illustrates the complex multi-layered nature of the atmosphere with the grey cloud that passes by above the dominant dense cloud layer which now covers most of populated China.
The final mechanistic part of all this are the jetstream (11-19kms high) winds from the. Here we see the period from the 4th to the 6th covered in the last two satellite animations.
The dominant feature is the main band running west to east.
The dominant feature is the main band running west to east.
One of the features in this perfectly explains this rain event over Iran and Afghanistan over the last 24 hours.
This trough like feature caused by a very sharp meander in the Jetstream similar to those we see very regularly now over Europe. The Northerlies on the left hand side bring cold air which causes the heavy rain/snow.

The extreme precipitation events which you see here (all those over the Sahara and ME are very large and most were also intense), were unusual.
Their 1st cause is the presence of water which arrives via this persistent west east jetstream.
Their 1st cause is the presence of water which arrives via this persistent west east jetstream.
https://twitter.com/althecat/status/1479083256469405700?s=20
But each of these nation sized storms has its own detailed explanation, an intersection of streams, cold air, a nearby low etc.
And its the details which make these storms dangerous, usually only one part of these rain events is extremely hazardous or damaging, e.g. the duration and intensity of the storm over Kuwait on Sunday/Monday.
https://twitter.com/althecat/status/1477682330760269825?s=20
This was just a tiny part of a much larger storm, the impact of which was largely due to geography, specifically the presence of mountains. And this storm took at least 11 lives in Iran. and did massive amounts of damage. ncr-iran.org/en/ncri-statem…
https://twitter.com/althecat/status/1477674503425646595?s=20
My working hypothesis for the past 9 months whilst monitoring signs of apparent signs of climate change in North Africa and the Middle East has been simple:
Warmer air carries more water = more rain.
Current 16 day rainfall forecasts:
1. India
2. China
3. ME
4. Eurasia
Warmer air carries more water = more rain.
Current 16 day rainfall forecasts:
1. India
2. China
3. ME
4. Eurasia


This held true over the northern hemisphere summer and now it appears to be doing so over winter, albeit in unexpected ways.
/ENDS
@ThreadreaderApp unroll
/ENDS
@ThreadreaderApp unroll
• • •
Missing some Tweet in this thread? You can try to
force a refresh


