Jim Bianco Profile picture
Jan 6, 2022 5 tweets 3 min read Read on X
1/5

Narrative is US cases will peak any day following South Africa pattern.

Keep in mind:

* South Africa is only 30% vaxxed (US 63%)
* It's young with few restrictions
* So, everyone "breathed on each other" cases went up 100x in 30 days and then peaked.
2/5

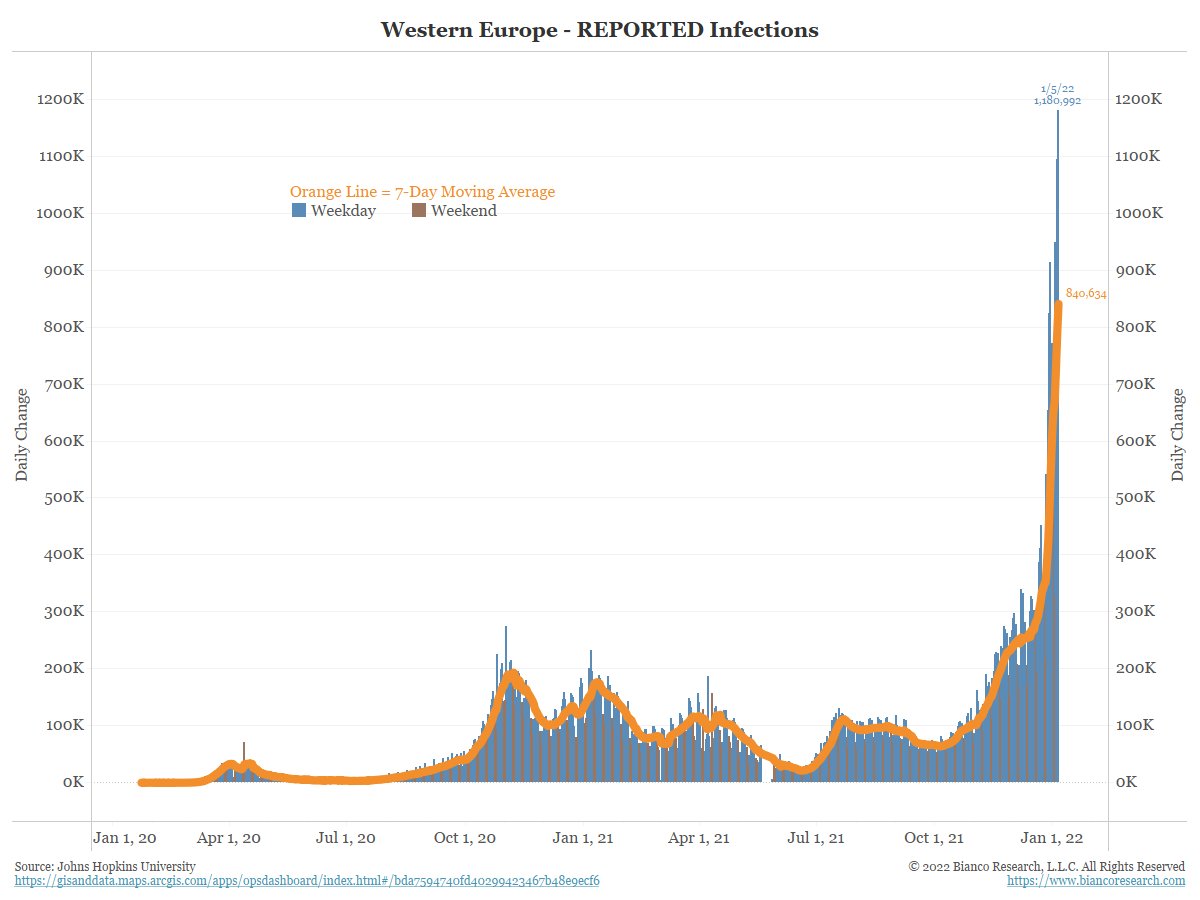
Why isn't Europe a better model for the US?

They are trying to prevent spread with restrictions/lockdowns (Dutch). So, they are dragging it out and made another new high yesterday.

EU is not willing to go 100x in 30 days like SA, so they are taking a longer time to peak.
3/5
If the US was indeed following South Africa and going to peak any day, our 7-day positive avg would be about 3M now, not ~600k.

We are trying to slow it down, and it is working!! EU leads the US by 6 weeks. If the EU peaks today, the US peaks in 2H of Feb at the earliest.
4/5

Is the EU/US just too big (population) to peak without the world peaking?

So far, the world is not peaking
5/5

My interest is economic, when is the massive loss of workdays going to peak.

How massive? In the last 10 days nearly 2.8% of the US workforce tested positive and it most likely out.

This will contribute to lost production pushing up prices (inflation). See the airlines.

• • •

Missing some Tweet in this thread? You can try to force a refresh
 

Keep Current with Jim Bianco

Jim Bianco Profile picture

Stay in touch and get notified when new unrolls are available from this author!

Read all threads

This Thread may be Removed Anytime!

PDF

Twitter may remove this content at anytime! Save it as PDF for later use!

Try unrolling a thread yourself!

how to unroll video
  1. Follow @ThreadReaderApp to mention us!

  2. From a Twitter thread mention us with a keyword "unroll"
@threadreaderapp unroll

Practice here first or read more on our help page!

More from @biancoresearch

May 18
1/7

Interesting argument by @RickRieder.

🧵on why he might not want to be correct.

----
Americans are earning more than they have in years from fixed-income investments, given that benchmark rates remain on hold at their highest level in a generation, according to Rieder, BlackRock’s chief investment officer of global fixed income.

“I’m not certain that raising interest rates actually brings down inflation,” Rieder told Bloomberg’s David Westin for an upcoming episode of Wall Street Week airing Friday.

“In fact, I would lay out an argument that actually if you cut interest rates, you bring down inflation.” Middle- to higher-income Americans “are getting a big benefit from these interest rates,” he said.
2/7

Rick Rieder argues the classic Modern Monetary Theory (MMT) idea that interest income causes a “wealth effect” that leads to more spending/demand and, thus, higher prices.

So, if the Fed cuts rates and reduces this wealth effect, spending (demand) would cool, and inflation would moderate.
--
The chart below breaks down all government and municipal securities holdings by the owner’s income. The top 1% of households by income own almost 40% of all these bonds, and the top 50% of income owns 99% of these bonds.

Reider is correct. Most interest income goes to the top earners.Image
3/7

And the top incomes in the United States comprise the majority of spending. The top 50% of income accounts for 70% of spending.

The argument goes that lowering rates would reduce the income received by these top groups and reduce their wealth effect, leading to less spending, cooling demand, and bringing down inflation.Image
Read 7 tweets
May 8
1/9

I've been asked about my stance on yields. Do I still think the 10-year yield is going to 5.00%—5.50%?

Yes

But I also took a neutral stance a few weeks ago.

75% of the move is over.

🧵
2/9

Where did 5.00% - 5.50% come from.

The belief is that the 40-year bond bull market is over (in 2020), and a multi-year bond bear market is continuing.

So, 5.00% - 5.50% is a higher high than the 5% peak of last October, as would be expected in a bear market. Image
3/9

That said, we did move our Index to neutral duration from being short since late last year. 75% of the move is over.

Recall we manage the Bianco Research Total Return Index. The ETF $WTBN tracks our Index (similar to SPY tracks SPX)

Explained here
biancoadvisors.com/may-2024-index…
Read 9 tweets
May 5
1/6

A great piece by @EconTodd and James Carter about how the US Treasury messed up the last 15 years ago. (h/t @judyshel)
---
Rather than issuing 50- or 100-year bonds when interest rates were at rock-bottom, the US Treasury dismissed this option and simply continued to borrow on a short-term basis. Now that US interest payments are ballooning, the scale of this blunder has become apparent, as have the implications for future generations.

project-syndicate.org/commentary/sup…
2/6

This almost triggered me to read as I have been arguing the same thing.
---
April 29, 2012

“I don’t get why the Treasury thinks floaters are a good idea with short-term rates at zero percent, as they only have one way to go, and that’s up,” said James Bianco, president of Bianco Research LLC in Chicago in an interview on April 24.

“They should be lessening the cost of financing the United States government for the taxpayers,” Bianco said. “The Treasury should be issuing 100 year or perpetual bonds until the market can’t stand it anymore to lock in these rates.”

bloomberg.com/news/articles/…
3/6

In a 2019 op-ed I wrote for Bloomberg ...
---
For more than 60 years, the Treasury has relied on a select group of primary dealers – currently numbering 24 - who are not only authorized to trade with the Fed, but are also obligated to bid at government debt auctions. That means they are expected to put their own capital at risk and buy the securities issued by the Treasury. This group of dealers accounts for a large chunk of the Treasury Borrowing Advisory Committee, or TBAC, which counsels the government on its financing needs.

The Treasury has historically placed a great deal of weight on this group’s recommendations. The TBAC has lately stressed the importance of regular and predictable securities issuance, along with demand for that issuance. When the Treasury brought up the idea of ultra-long bonds in 2017, the TBAC cautioned against the move and pointed to surveys of investors that suggested tepid interest.

bloomberg.com/view/articles/…
Read 6 tweets
May 1
1/6

As this chart shows, the current BTC price is the average purchase price of the Spot BTC ETF buyers. ~$57K to ~$58K Image
2/6

So, about $37 billion in Spot BTC assets (x-GBTC) now have no profits and maybe a small loss. Image
3/6

As I have been detailing, the 13F shows very little institutional buying of these ETFs. 95+% of the buyers are either hedge funds, institutional investors holding less than $100m, or retail degens.

Retail degens dominate.


Read 6 tweets
Apr 28
1/11

The more data we get, the more I worry about the risks involved with Spot ETF.

🧵to update
--
Investment Advisors hold about 35% of all ETFs. However, they hold less than 1% of the new Spot BTC ETF.

"Here come the boomers" was/is a myth.

2/11

Why does this matter?

It confirms my fear that the Spot BTC ETFs are effectively "orange FOMO poker chips" for paper-handed small-time traders (degens).

These degens are getting close to their breakeven, which could turn them in big-time sellers.

Let's dig in.
3/11

A Citi study shows that investment advisors (IAs) hold ~35% of all ETFs. The table shows the 4 largest BTC ETFs. IA's (blue ribbon) hold less than 1% of the New BTC ETFs.

For comparison, see the two popular non-equity ETFs, GLD and TLT. IAs hold 22% of HYG and 40% of TLT. Image
Read 11 tweets
Apr 21
1/6

The deficit as a % of GDP (bottom), now 5.93%, is higher than in any period except the Great Recession (2007 - 2009) and the 2020 COVID shutdown (dotted line).

The government is borrowing to spend money like the economy is trying to recover from a recession. Image
2/6

This separates Federal revenues (orange) and spending (blue).

The difference is the deficit (middle panel).

The bottom panel (black) shows that taxes only cover 73% of federal spending. The other 27% has to be borrowed. Image
3/6

Yearly federal spending is $6.24 trillion or 22.3% of the US economy (or nominal GDP).

Like the deficit chart above, the only time the government has spent this much as a % of GDP is when trying to get the economy out of a recession.

The economy is in year 4 of a recovery.Image
Read 6 tweets

Did Thread Reader help you today?

Support us! We are indie developers!


This site is made by just two indie developers on a laptop doing marketing, support and development! Read more about the story.

Become a Premium Member ($3/month or $30/year) and get exclusive features!

Become Premium

Don't want to be a Premium member but still want to support us?

Make a small donation by buying us coffee ($5) or help with server cost ($10)

Donate via Paypal

Or Donate anonymously using crypto!

Ethereum

0xfe58350B80634f60Fa6Dc149a72b4DFbc17D341E copy

Bitcoin

3ATGMxNzCUFzxpMCHL5sWSt4DVtS8UqXpi copy

Thank you for your support!

Follow Us!

:(