*New Data* from @CIHI_ICIS

Can you spot the pandemic?
We can now compare hospital/ICU data for the "pandemic" period to the 2019 "pre-pandemic" period.

1. 🇨🇦 ICU Admissions by Diagnosis:

Pandemic admits below '19 pre-pandemic levels. "Major respiratory" a minimal contributor.
2. 🇨🇦 Total Inpatient Hospital Admissions by Diagnosis:

Overall pandemic hospitalizations below pre-pandemic levels. Major respiratory diagnosis a minimal contributor to overall admissions.

Hospitals are in crisis?
3. 🇨🇦 Total Ventilations by Diagnosis:

Overall pandemic ventilations below pre-pandemic levels. Major respiratory diagnosis more pronounced, but other diagnoses lower (may have been some attribution differences).

Again, where is the crisis?
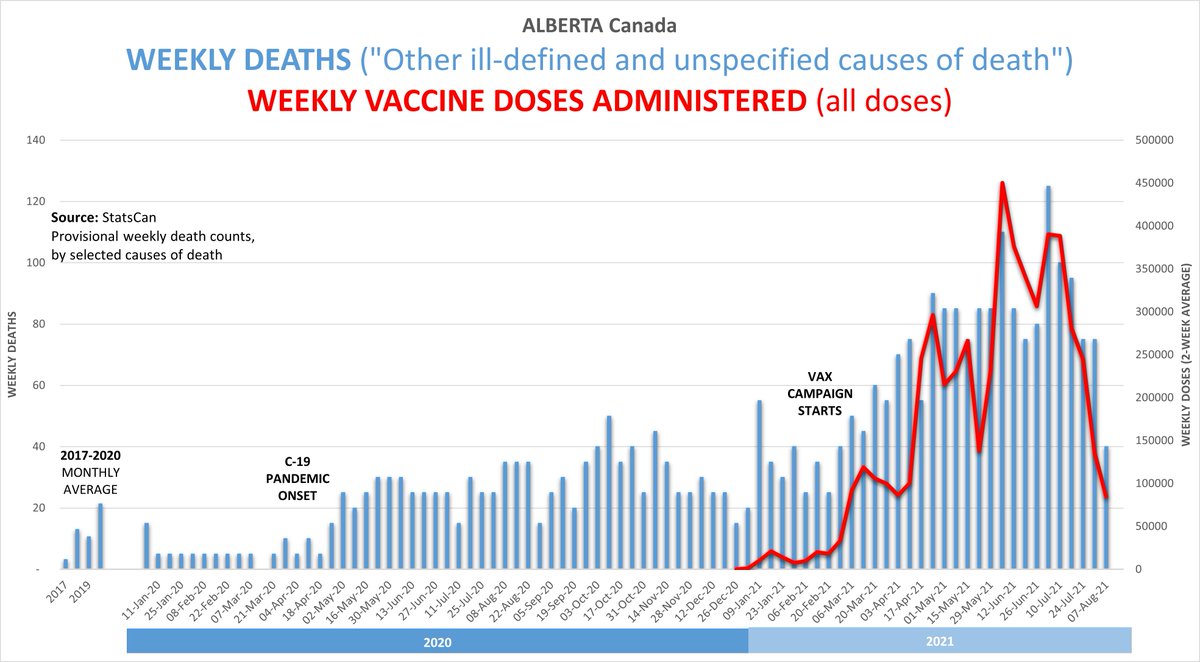
Most shocking of all...

4. Ontario Hospital Census and ICU Census:

"Pandemic" and "pre-pandemic" periods are immaterially different.

Where is the crisis?
5. Ontario Surgical Volumes

Surgeries had major decline during 1st wave, but monthly averages have recovered to near pre-"pandemic" levels since 1st wave. Monthly average of Cancer/Cardiac surgeries now just 6% below pre-"pandemic" averages (incl. 2nd and 3rd waves!).
I hope the above data provides some much needed perspective, especially in light of our politicians and public health officials continuing with societal shutdowns and economic damage under the pretense of protecting the hospital system.
Datasets available to all from @CIHI_ICIS here: cihi.ca/en/covid-19-re…

Data caveats shows here:
@CIHI_ICIS One more caveat, most of the data for April - June 2021 are provisional and subject to change. All Canada-wide data referenced excludes Quebec.

• • •

Missing some Tweet in this thread? You can try to force a refresh
 

Keep Current with Kelly Brown

Kelly Brown Profile picture

Stay in touch and get notified when new unrolls are available from this author!

Read all threads

This Thread may be Removed Anytime!

PDF

Twitter may remove this content at anytime! Save it as PDF for later use!

Try unrolling a thread yourself!

how to unroll video
  1. Follow @ThreadReaderApp to mention us!

  2. From a Twitter thread mention us with a keyword "unroll"
@threadreaderapp unroll

Practice here first or read more on our help page!

More from @rubiconcapital_

11 Dec 21
(1/4) MORE ON WINNING HEARTS AND MINDS

As we mix regardless of vaccination status, in respect of each other's medical choices, we ought to share in our unspoken sadness that we are being dehumanized though inescapable use of QR codes for all manner of activities. #heartsandminds
(2/4) MORE ON WINNING HEARTS AND MINDS

And with our vaccinated friends and family, together we can reflect on a changing definition of fully vaccinated, which invalidates and betrays those who previously chose vaccination. #heartsandminds
(3/4) MORE ON WINNING HEARTS AND MINDS

And further, we can continue to reflect on the ever present threat of new, arbitrary societal restrictions (cancelled celebrations, shrunken gatherings, lockdowns) DESPITE vaccination and boosting! #heartsandminds
Read 4 tweets
19 Nov 21
From Stats🇨🇦 weekly death counts by cause of death:

In Ontario, AB and BC, "Ill-defined & unspecified causes of death" have been rising in sync with C19 vaccine dose administration.

NOTE: correlation only (but troubling). @PublicHealthON should investigate possible causation👇
Here is Alberta (cc: @AHS_media):
Here is BC. Less pronounced than Ontario and Alberta. Note: a large spike of deaths (600) was removed for the week ending July 3rd, 2021 as these may have been heat-wave related (same week).
Read 6 tweets
19 Nov 21
BRAVO IRVIN: "As I am against mania, always, I ask for the immediate resignation of one of its chief exponents in the leading province of the land. Dr. Moore must resign. And the mania must stop now."

Dr. Kieran Moore: It is time that you resign in disgrace.

#resignKieranMoore
Read 5 tweets
17 Nov 21
JUST NOW
(1/3)
Toronto MoH @epdevilla on child/youth vax.

Post-vax myocarditis risk is downplayed/inadequately communicated!

She cites population rate of 24.2 per 1m (PHO data), but does not clearly indicate the rate for 12-17 males is 5.5x higher (133.5/m) post 2-dose Pfizer!
JUST NOW
(2/3)

Listen closely: @epdevilla compares the all ages/sexes post-vax myo rate of 24.2 per 1m doses to the estimated 12-17yo post-C19 myo rate of 450 per 1m...

...without clearly stating the at least ~197 per 1m total risk for 12-17yo males post-vax reported by PHO!
JUST NOW
(3/3)

@epdevilla acknowledges myocarditis risk in males, but then downplays: cites NACI's "rare" characterization; "occurring in 0.01% to <0.1%" of vax recipients".

That is 1 in 1,000 to 1 in 10,000!

This is unacceptable risk; particularly for healthy young men!
Read 5 tweets
12 Nov 21
Ontario Myocarditis Data Update
⏺️Large data dump w/45 new cases
⏺️Now 521 total cases
⏺️~1/2 in 12-29yo males
⏺️Pfizer: 12-17 yo's now 1 in ~5,000 & still📈

@PublicHealthON what's taken so long to report these cases? Dose levels low since summer, but reports still coming in!
Here you can see the week over week changes. Increases across many ages/sexes/doses. Young males continue to bear the brunt of this vaccination injury. Very sad.
Read 4 tweets

Did Thread Reader help you today?

Support us! We are indie developers!


This site is made by just two indie developers on a laptop doing marketing, support and development! Read more about the story.

Become a Premium Member ($3/month or $30/year) and get exclusive features!

Become Premium

Too expensive? Make a small donation by buying us coffee ($5) or help with server cost ($10)

Donate via Paypal

Or Donate anonymously using crypto!

Ethereum

0xfe58350B80634f60Fa6Dc149a72b4DFbc17D341E copy

Bitcoin

3ATGMxNzCUFzxpMCHL5sWSt4DVtS8UqXpi copy

Thank you for your support!

Follow Us on Twitter!

:(