The EU is in a gas crisis, the details of which we explained in various threads on this channel.
Ironically however, the liberalisation of the European gas markets is a huge success story. A brief history & some present day observations on gas security (#Gazprom).
Thread
1/n
Ironically however, the liberalisation of the European gas markets is a huge success story. A brief history & some present day observations on gas security (#Gazprom).
Thread
1/n
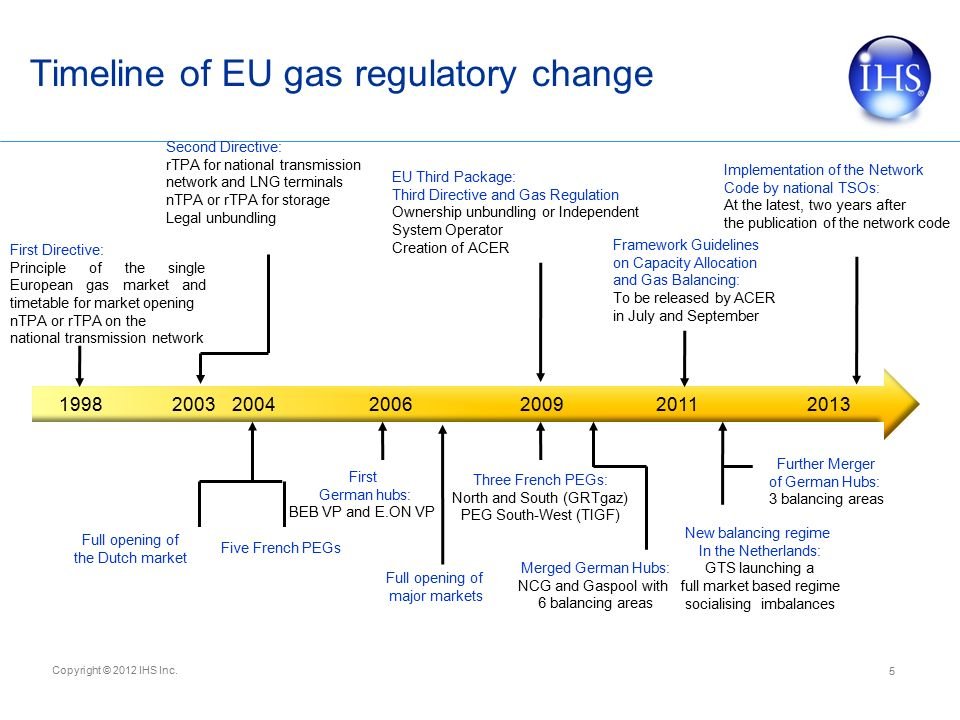
With the liberalisation of EU gas & electricity markets in 1998, in theory consumers were able to freely choose their supplier & shop for the best deal. However, most households and businesses still lacked a real choice of supplier well into 2014. Why?
2/n
2/n
A Commission inquiry into the energy sector, published in February 2006, identified a number of "serious malfunctions" in the market as most countries maintained their local monopolies.
3/n
ec.europa.eu/competition/se…
3/n
ec.europa.eu/competition/se…
In 2006, the Commission's Antitrust Dept. conducted surprise inspections of European champions, incl. E.ON, Gaz de France & OMV, on suspicion they were restricting competitors' access to pipelines & storage or engaged in "market-sharing" practices.
4/n
monopolkommission.de/images/PDF/SG/…
4/n
monopolkommission.de/images/PDF/SG/…
The findings persuaded the EU executive to propose a 3rd energy liberalisation package, tabled in Sept 2007. After lengthy negotiations, the Parliament & the Czech EU Presidency struck a compromise on the legislative package on 23 March 2009.
5/n
5/n

Fast forward to 2020: The liberalisation turned a patchwork of national gas markets into an integrated whole which allowed gas to flow freely across borders. Meanwhile, the new hub TTF lowered prices and saved €70bn when compared to the OPE pricing. A huge success!
6/n S: IEA
6/n S: IEA

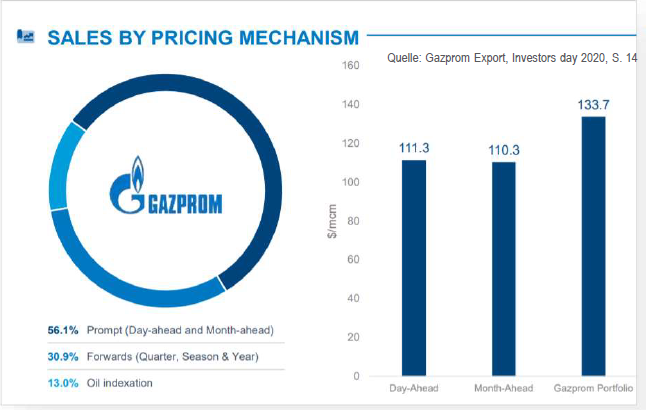
Today, 80% of EU gas contracts are "Gas-on-Gas" (GOG), i.e. a price discovered by a market. Back in 2005, that was true for a mere 10% while 80% of contracts were linked to crude oil, a system known as "Oil Price Indexation" (OPI or OPE).
7/n Source: IGU Survey 2020
7/n Source: IGU Survey 2020


OPE provided a relatively stable reference price that underpinned large-scale investments in upstream projects, pipelines or liquefied natural gas terminals. Such infrastructure are among the most capex-intensive. They require long-term revenue planning.
8/n
8/n

However, gas prices did not reflect supply-demand fundamentals of the gas market itself, and buyers in the EU were unable to take advantage of periods of lower-cost supply, particularly following the US shale gas revolution which took off in 2010.
9/n
9/n
The 3rd liberalisation package received, who would have thought, a lot of push back from #Gazprom, the de-jure Russian monopoly on gas & the largest supplier to Europe's 540bcm market (2021E). Prospects of new competiton & lower prices was a thread, not just to Gazprom.
10/n
10/n

In 2005, profits from the sale of oil & gas exports represented 35% of total government income & 50% of the federal budget. That hasn't changed. #Russia needs EU gas revenues as much as the EU needs Russian gas from Gazprom!
11/n @OlafScholz
ifri.org/sites/default/…
11/n @OlafScholz
ifri.org/sites/default/…
Despite geopolitics, the EU included a reciprocity clause in its liberalisation package - quickly dubbed the 'Gazprom clause' - in response to fears that ownership unbundling would lead to M&A of strategic EU transmission assets by Gazprom. Elegant!
12/n
euractiv.com/section/med-so…
12/n
euractiv.com/section/med-so…
A particular irritant is a rule that prevents companies from controlling the supply & distribution in a single market. Lithuania used it & made #Gazprom a forced seller in 2014 – something Moscow likened to a Soviet-era expropriation of property.
13/n
reuters.com/article/uk-lit…
13/n
reuters.com/article/uk-lit…
The liberalisation hurt Gazprom's revenues for past decade due to the shift from OPE to GOG prices. However, the EU missed its security target of diversifying gas supplies. Gazprom's EU guidance is for 183bcm in 2021 or 34% (likely too high). It was 166bcm in 2006 (27%).
14/n
14/n
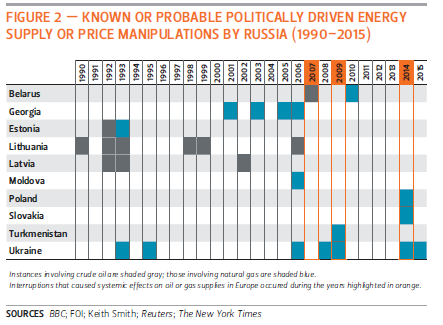
And so Russia's "tradition" to use gas as a geopolitical weapon can continue. No wonder accusatory fingers have been pointed at Russia, too, in the ongoing EU gas crisis.
15/n
15/n
One way to illustrate the "unusal" today is by isolating Germany's gas storage cycles over some years. #Gazprom operates 25% of German storage. It's ridiculous (especially when certain Twitter experts explain Gazprom's EU storage business was unprofitable - in 2021!).
16/n
16/n
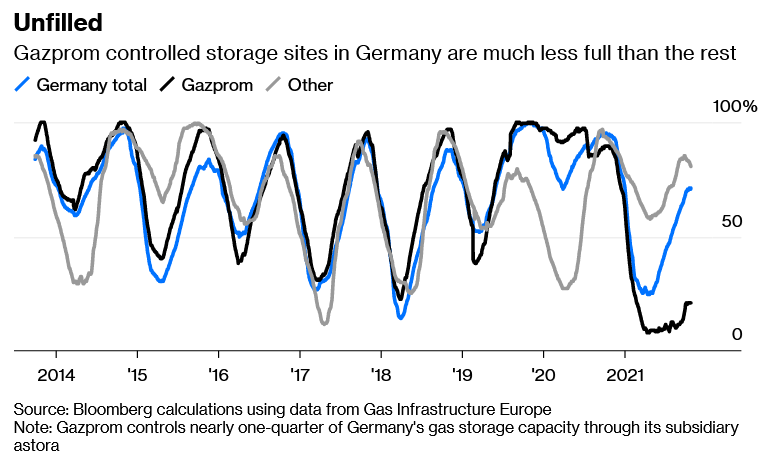
Gazprom's EU storage remains seasonally-adjusted low despite VVP's promises for more (watch what they do, not what they say). It may well have supplied its contracted gas, but has not replenished 10bcm EU storage (= Groningen; 5.5% of 183bcm 2021 EU export guidance).
17/n
17/n

If Gazprom couldn’t pump enough gas to fill both its domestic & overseas facilities (Russia had an unusually long winter 2019/20), EU leaders need to worry that Russia’s lack of production capacity has to be added to its long list of supply worries (UK, NL, ..).
18/n
18/n
EU politicians were reluctant to celebrate their success. Smart. The liberalisation failed to deliver one objective – supply diversification. The EU dependents on Russian gas while its latest green policy proposal worsens that..!
19/19 Pls retweet; thx
ft.com/content/7f84c0…
19/19 Pls retweet; thx
ft.com/content/7f84c0…
• • •
Missing some Tweet in this thread? You can try to
force a refresh