Here's the latest variant picture for BA.2 (Omicron), the lesser-known sibling of BA.1 (Omicron).
It has started to appear at surprisingly high frequencies in several countries - those who shared the most samples are shown here.
🧵
It has started to appear at surprisingly high frequencies in several countries - those who shared the most samples are shown here.
🧵
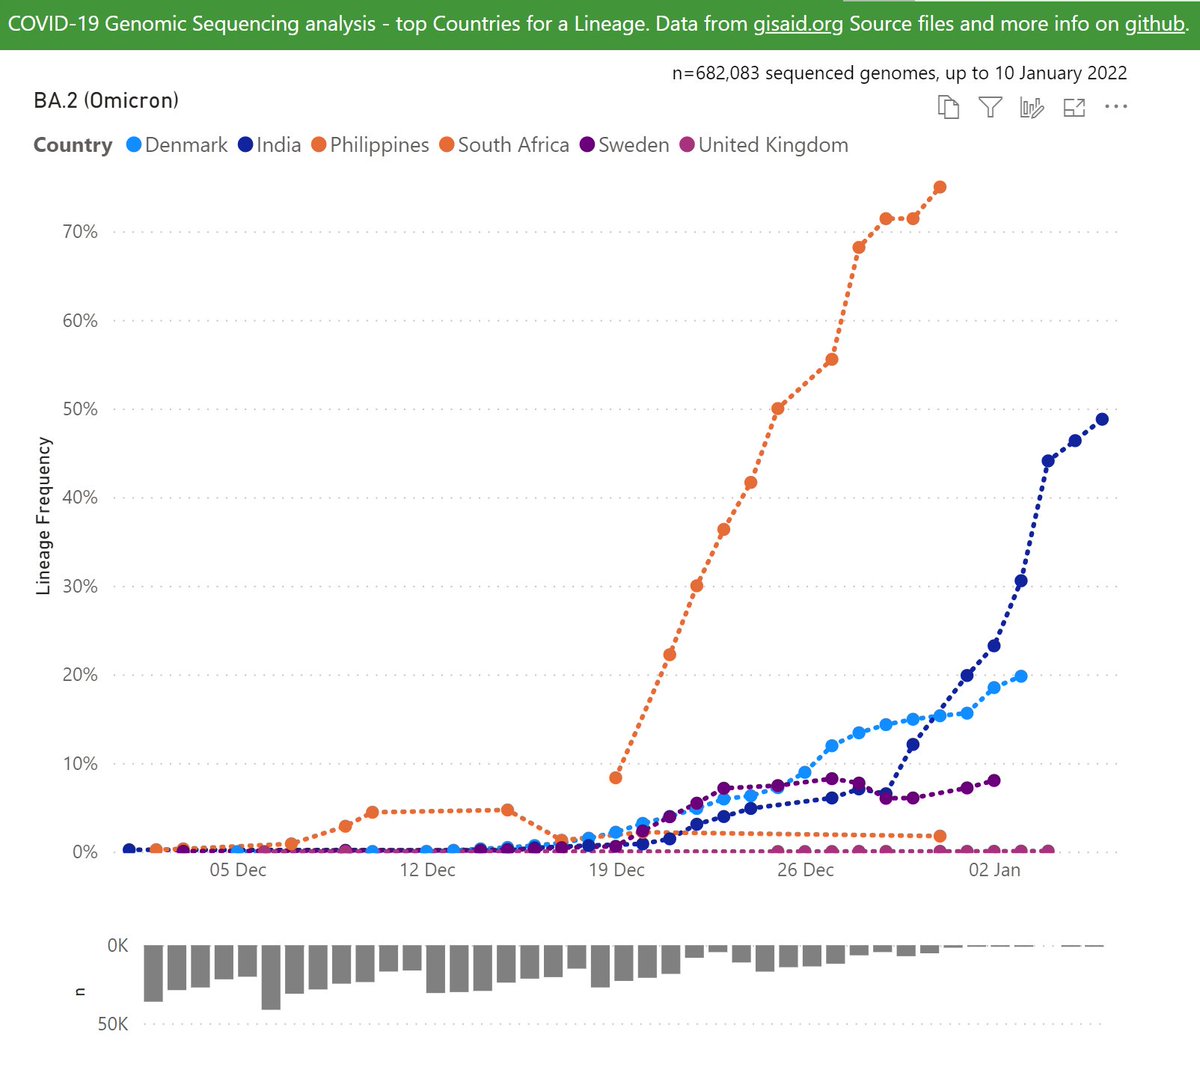
Note the Frequency is calculated for each country independently, comparing to all the recent samples sequenced in that country.
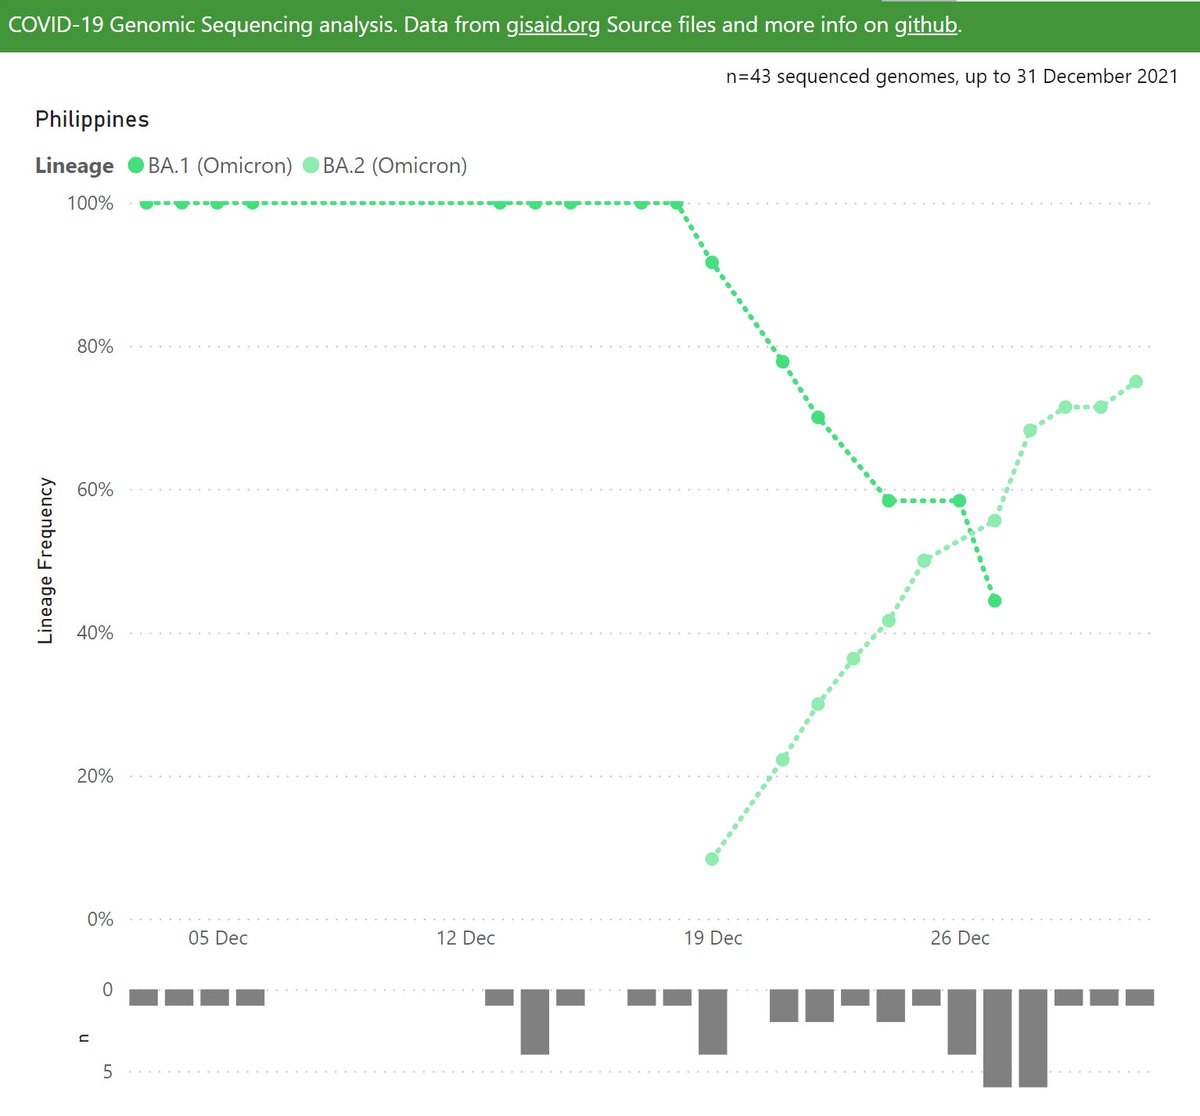
Here's the latest variant picture for the Philippines.
Perhaps this startling picture can be discounted, as the sample sizes are very small. They have reported 20 samples of BA.2 (Omicron).
Perhaps this startling picture can be discounted, as the sample sizes are very small. They have reported 20 samples of BA.2 (Omicron).
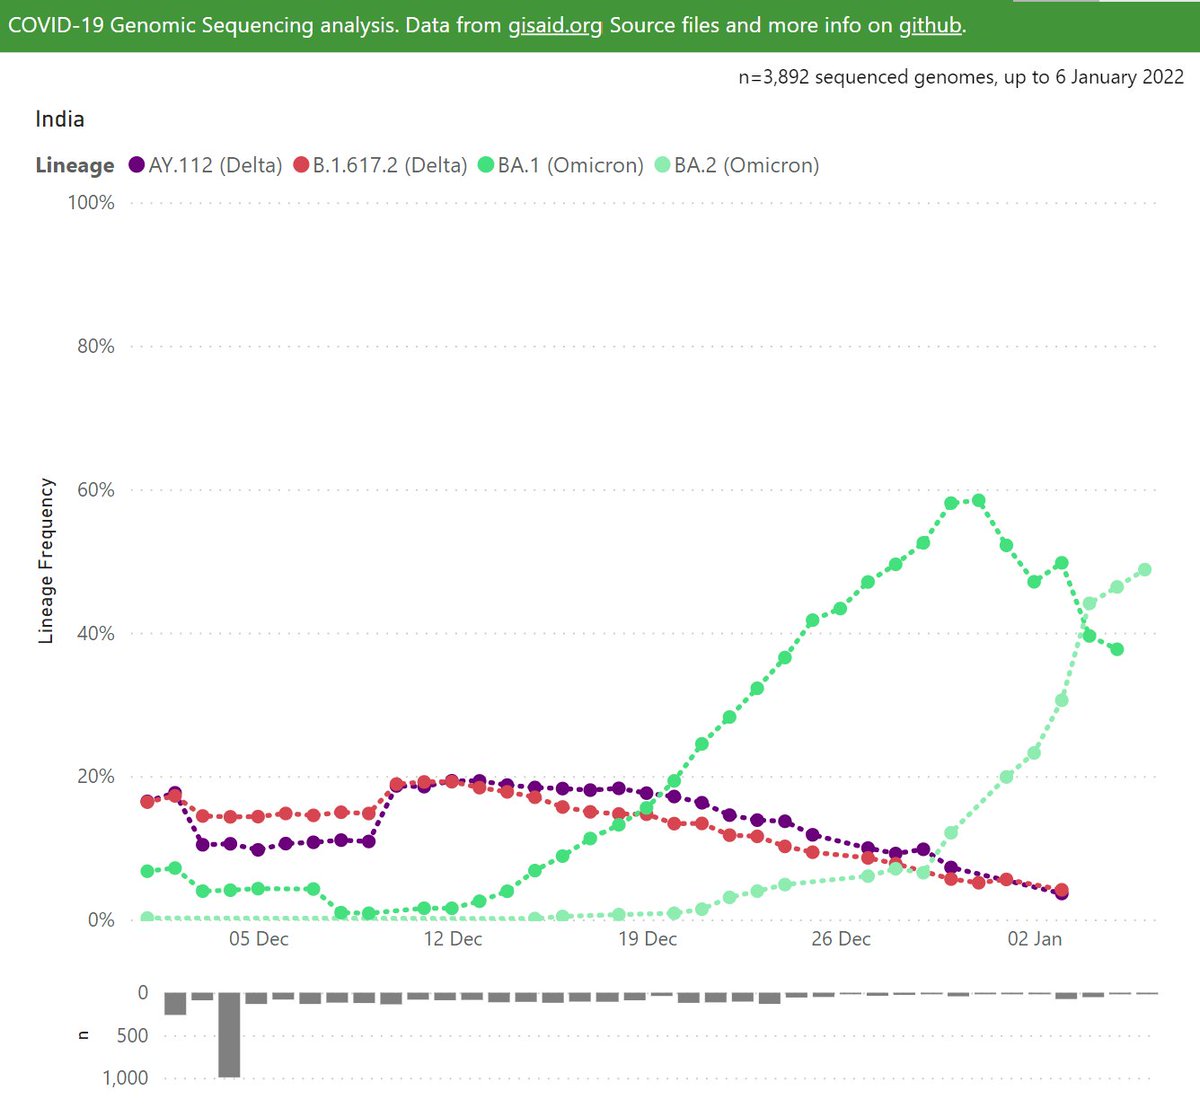
Here's the latest variant picture for India.
It appears that BA.2 (Omicron) is successfully competing with its sibling lineage BA.1.
BA.2 has risen recently to ~50%, while BA.1 has declined from a peak of ~60%.
It appears that BA.2 (Omicron) is successfully competing with its sibling lineage BA.1.
BA.2 has risen recently to ~50%, while BA.1 has declined from a peak of ~60%.
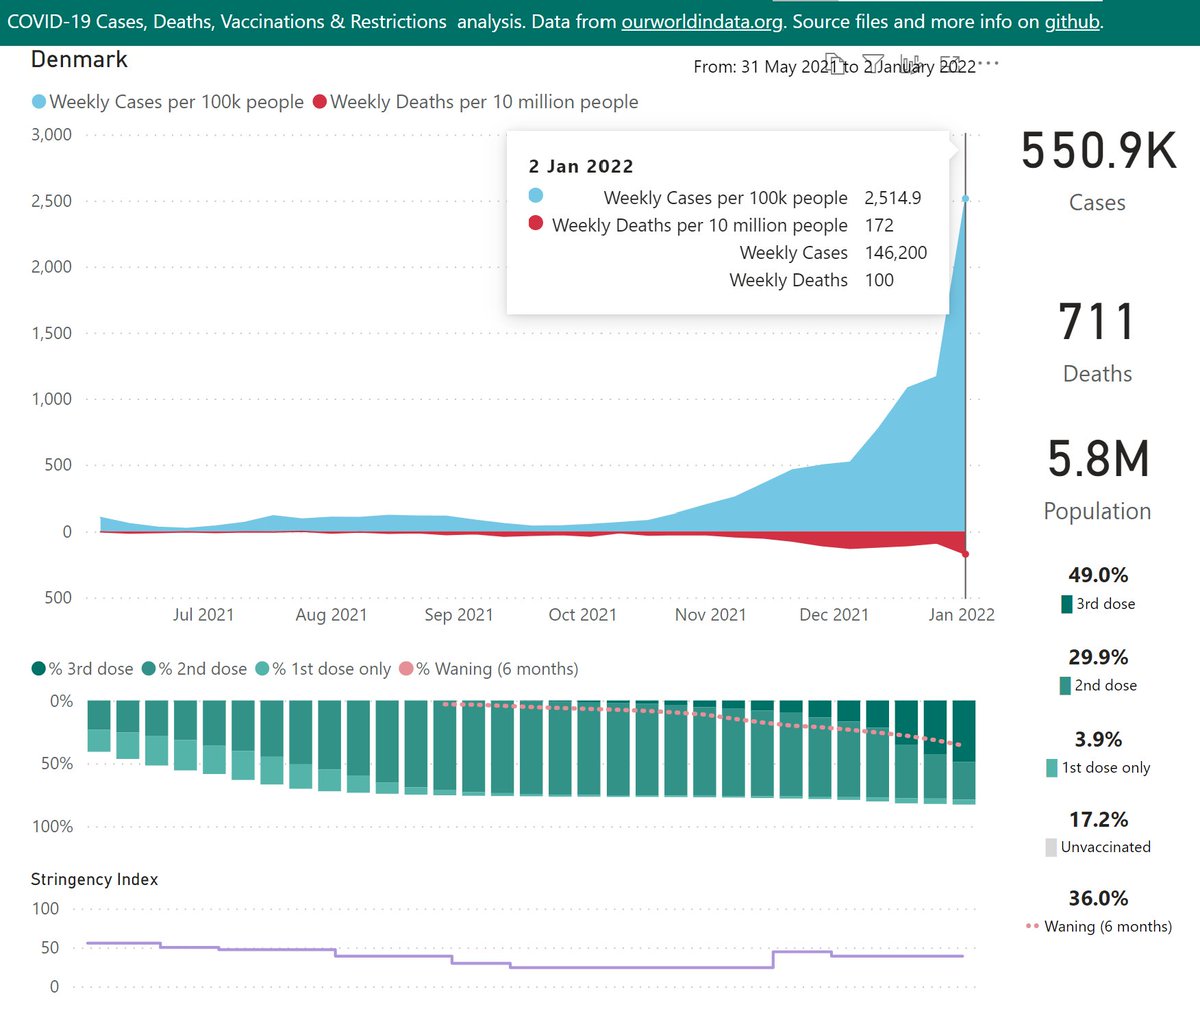
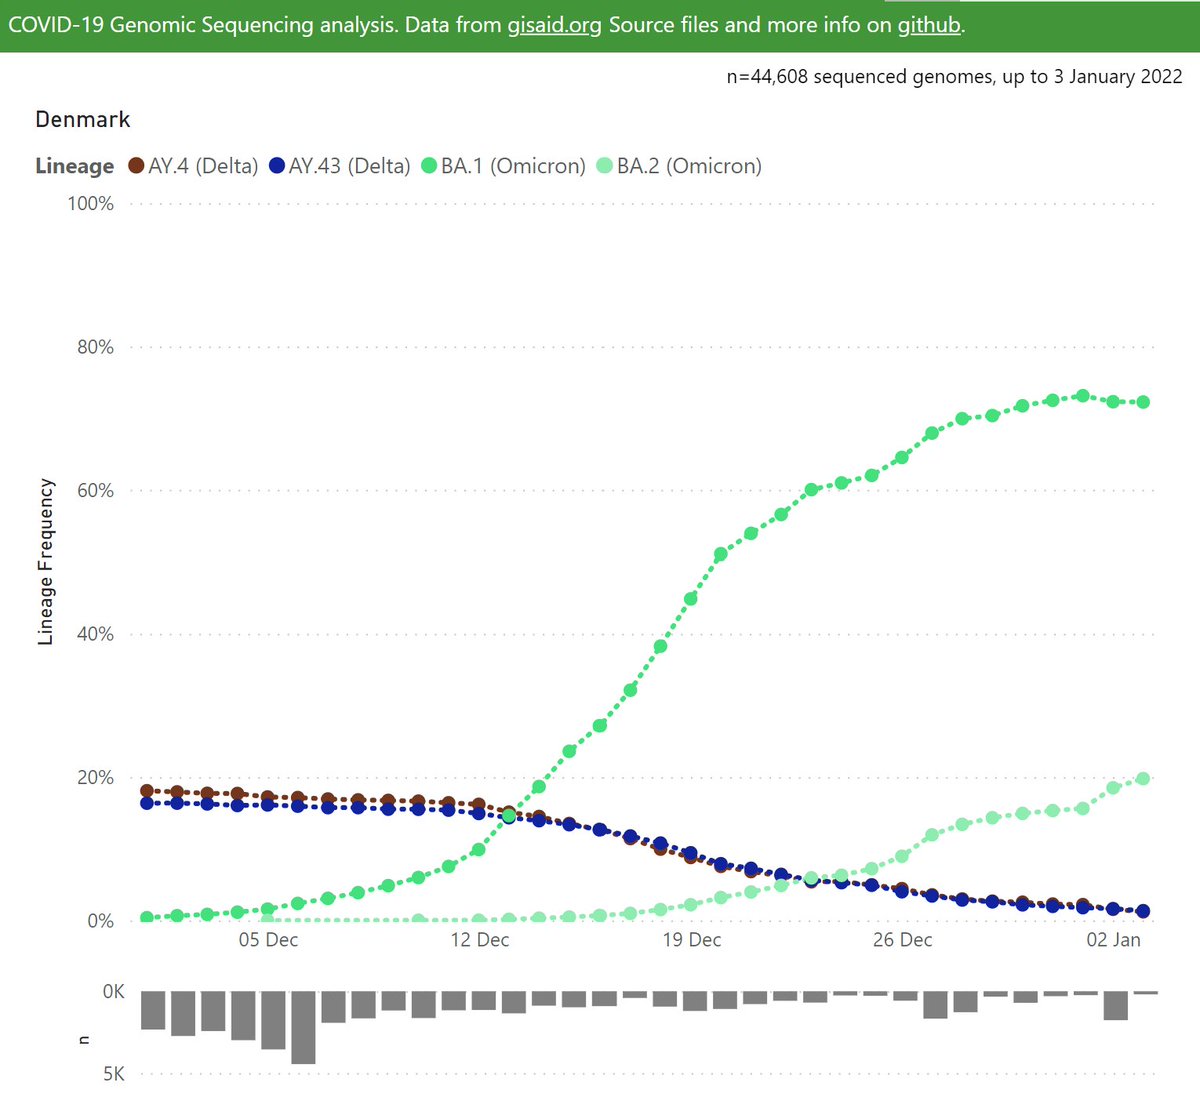
Here's the latest variant picture for Denmark.
BA.1 (Omicron) appears to have plateaued at around 70% frequency.
Meanwhile, its sibling BA.2 (Omicron) is rising steadily - recently up to 20%.
The Delta lineages have declined to ~1%.
BA.1 (Omicron) appears to have plateaued at around 70% frequency.
Meanwhile, its sibling BA.2 (Omicron) is rising steadily - recently up to 20%.
The Delta lineages have declined to ~1%.
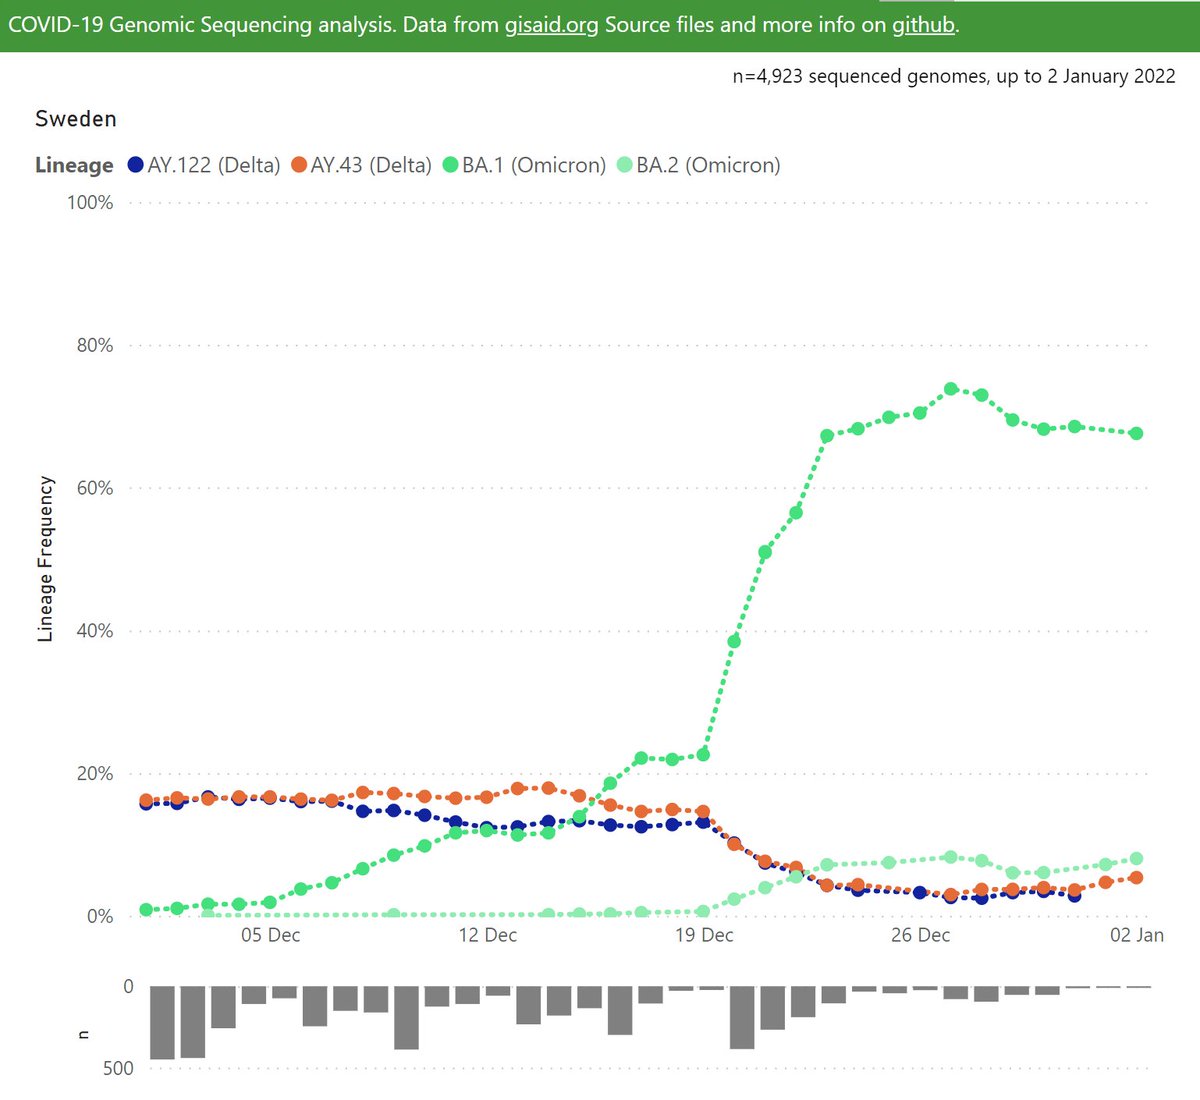
Here's the latest variant picture for Sweden.
BA.1 (Omicron) appears to have plateaued at around 70% frequency.
Its sibling BA.2 (Omicron) seems stuck below 10%.
BA.1 (Omicron) appears to have plateaued at around 70% frequency.
Its sibling BA.2 (Omicron) seems stuck below 10%.
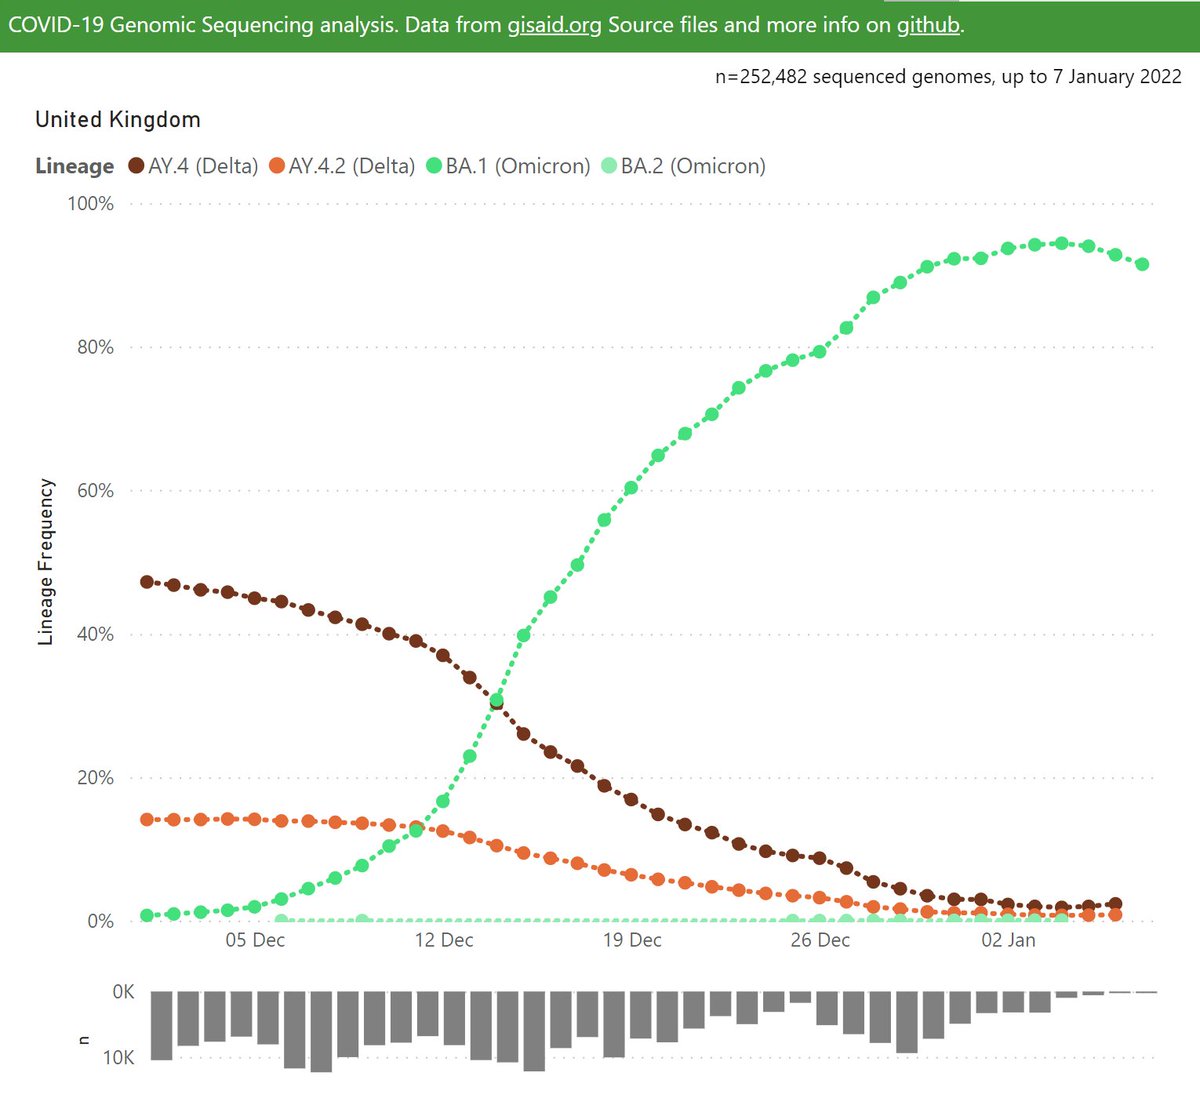
Here's the latest variant picture for the United Kingdom.
BA.1 (Omicron) appears to have plateaued at around 90% frequency.
Its sibling BA.2 (Omicron) is present but at a tiny frequency: <0.1%.
BA.1 (Omicron) appears to have plateaued at around 90% frequency.
Its sibling BA.2 (Omicron) is present but at a tiny frequency: <0.1%.
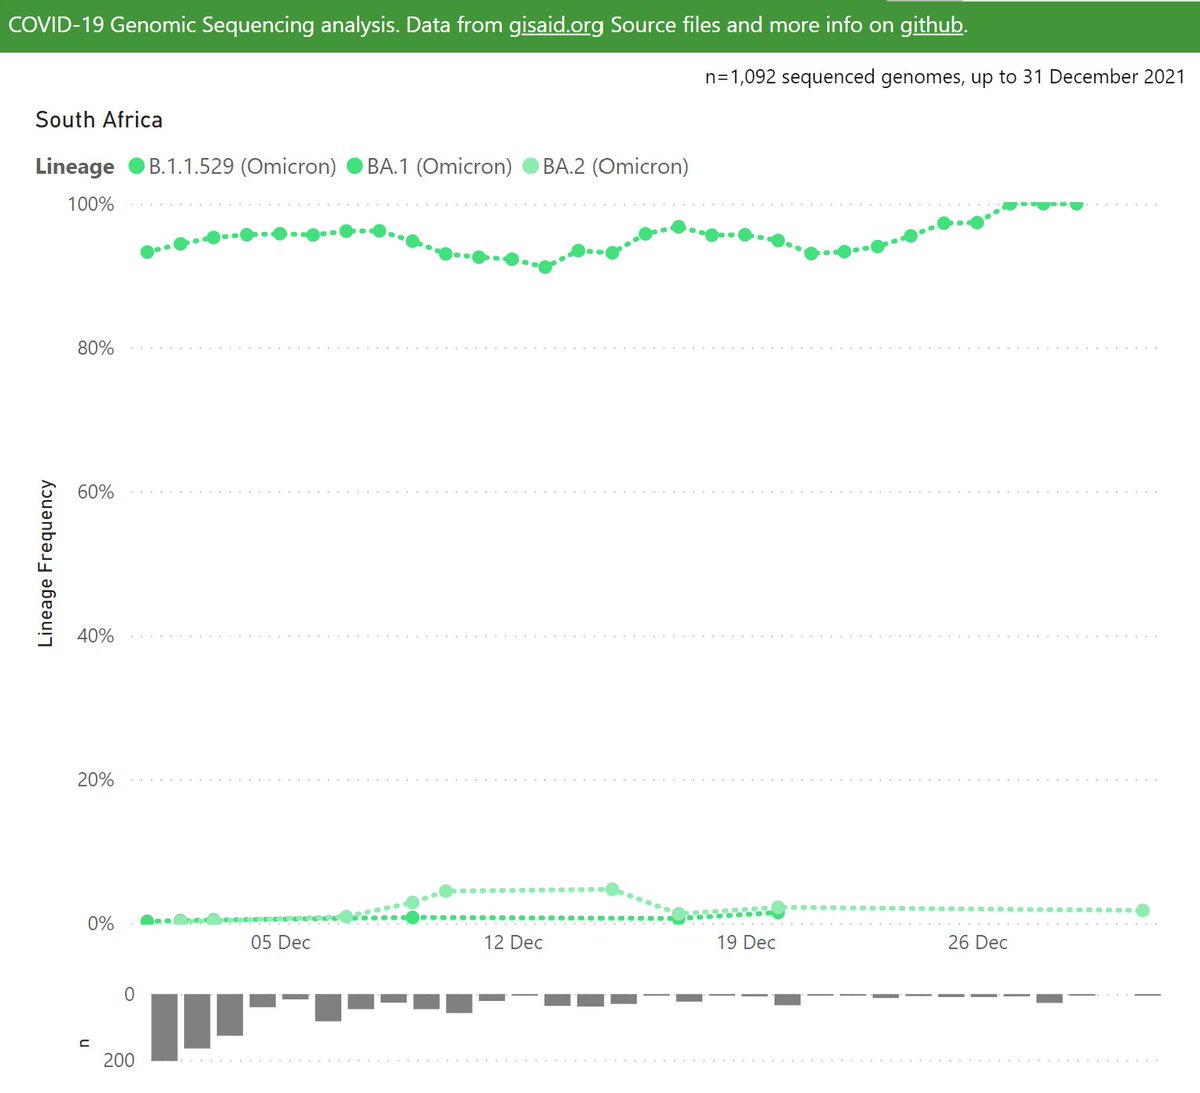
Here's the latest variant picture for South Africa.
BA.1 (Omicron) is very dominant at around 95% frequency, although recent sample sizes are low.
Its sibling BA.2 and parent B.1.1.529 are present, but at very low frequencies: <5%.
BA.1 (Omicron) is very dominant at around 95% frequency, although recent sample sizes are low.
Its sibling BA.2 and parent B.1.1.529 are present, but at very low frequencies: <5%.
Interactive dataviz here:
github.com/Mike-Honey/cov…
github.com/Mike-Honey/cov…
Here’s an explanation of how widely different BA.2 is:
https://twitter.com/shay_fleishon/status/1480933750041161731
• • •
Missing some Tweet in this thread? You can try to
force a refresh