There is a new @unusual_whales Hottest Chains & Tickers page: unusualwhales.com/flow/hot_chain…
This is a new and exciting, albeit easily misunderstood tool.
So, as always, please allow me to explain:
This is a new and exciting, albeit easily misunderstood tool.
So, as always, please allow me to explain:
To get to the page without a link, it's actually sort of hidden (I suspect to test it out!).
I highlighted and ninja'd the link to click on from the current page (here: unusualwhales.com/flow/hot_chains).
Or just use this link to get there directly: unusualwhales.com/flow/hot_chain…
I highlighted and ninja'd the link to click on from the current page (here: unusualwhales.com/flow/hot_chains).
Or just use this link to get there directly: unusualwhales.com/flow/hot_chain…

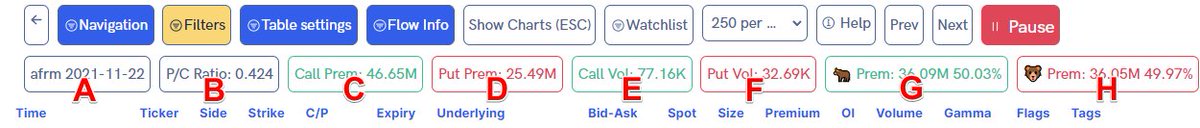
This is what the new page looks like.
It has some unique columns I have not seen elsewhere on the flow, such as "OHLC" and "Acc factor", so I feel obligated to review these as best I can.
I will review every column, though, so feel free to skip to whichever definition you need:
It has some unique columns I have not seen elsewhere on the flow, such as "OHLC" and "Acc factor", so I feel obligated to review these as best I can.
I will review every column, though, so feel free to skip to whichever definition you need:

Last Trade:
This is the time of the last trade on the chain. I imagine this is useful to gauge if folks are still trading on this chain, or whether or not it has already died down.
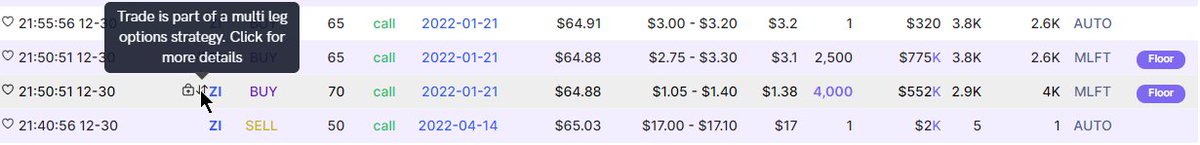
Chain:
This is the chain itself (NOT ONE TRADE), laid out as you're used to in the Flow already.
This is the time of the last trade on the chain. I imagine this is useful to gauge if folks are still trading on this chain, or whether or not it has already died down.
Chain:
This is the chain itself (NOT ONE TRADE), laid out as you're used to in the Flow already.


Bid-Ask:
This is the bid-ask spread on the chain *currently.* (Or perhaps as of the last trade?) Either way, this is very useful to let you know if that ship has sailed already or not. If the bid-ask has already changed a lot (or is too wide), steer clear, in my opinion!
This is the bid-ask spread on the chain *currently.* (Or perhaps as of the last trade?) Either way, this is very useful to let you know if that ship has sailed already or not. If the bid-ask has already changed a lot (or is too wide), steer clear, in my opinion!

OHLC:
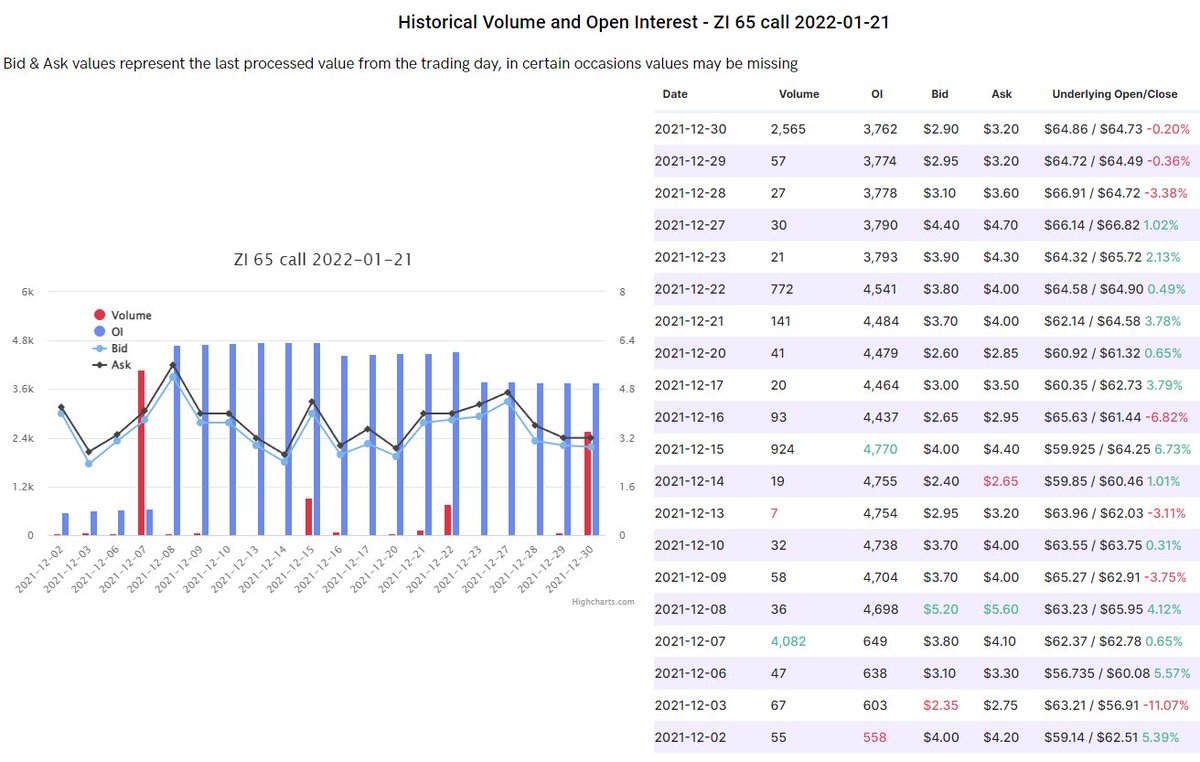
This is interesting. It's a small chart showing the the chain's open, high, low, and close price.
I've noticed that the high is always a factor of 1, so it is always a full bar.
The other bars are there so you can compare.
I'll explain all of them:
This is interesting. It's a small chart showing the the chain's open, high, low, and close price.
I've noticed that the high is always a factor of 1, so it is always a full bar.
The other bars are there so you can compare.
I'll explain all of them:

More about the OHLC (assumptions!):
- Open (blue): trade price of the first trade made (assuming on the date of flow)
- High (green): always a full bar, because other bars are relative to it, and is the highest price the contract has been traded thus far
- Open (blue): trade price of the first trade made (assuming on the date of flow)
- High (green): always a full bar, because other bars are relative to it, and is the highest price the contract has been traded thus far
OHLC continued (still assumptions!):
- Low (red): lowest price the contract has been traded thus far
- Close (gray): the price of the last price trade (so representative of the Last Trade column's trade)
I highlighted the close column and last trade to make that point stand out.
- Low (red): lowest price the contract has been traded thus far
- Close (gray): the price of the last price trade (so representative of the Last Trade column's trade)
I highlighted the close column and last trade to make that point stand out.

So what does OHLC tell us?
If we see the open and high are close together, we can interpret that as meaning there is still "plenty of room" for the contract to change since it began to heat up (and enter into this page).
If we see the open and high are close together, we can interpret that as meaning there is still "plenty of room" for the contract to change since it began to heat up (and enter into this page).
If we see Close is about the same as High, again, we can assume things are still waiting, as the last trade (Close) is still at the highest trade price.
If we see a low red (Low) bar, then we consider trades have happened lower than when this chain began to heat up (it's a dud).
If we see a low red (Low) bar, then we consider trades have happened lower than when this chain began to heat up (it's a dud).
All of these are *very quick* indicators to interpret, not dissimilar to P/C ratio (
So please don't "read into them"!
Let's move onto the next section...
(Whew, long thread. Hang in there!)
https://twitter.com/Crowd_Traders/status/1479996355011559428).
So please don't "read into them"!
Let's move onto the next section...
(Whew, long thread. Hang in there!)
Acc Factor (Acceleration Factor):
I think this is "acceleration" factor? No idea what that is, and I reckon it is the proprietary calculation for the page itself.
I think this is "acceleration" factor? No idea what that is, and I reckon it is the proprietary calculation for the page itself.

I actually sort my page by it, in fact, as things with a factor of 1 I believe are the things "heating up" the most quickly.
Here is my filter (for sticking with me for so long!): unusualwhales.com/flow/hot_chain…
I'll explain the filter another time (probably another thread).
Here is my filter (for sticking with me for so long!): unusualwhales.com/flow/hot_chain…
I'll explain the filter another time (probably another thread).
Acc factor probably takes into account how many trades a chain is getting and is doing some clever calculation with OI (historical?) to judge whether or not its worthy of the list.
As I've watched this page change throughout the day, I think it is the key metric to watch here.
As I've watched this page change throughout the day, I think it is the key metric to watch here.
Open Interest (OI):
Defines how many contracts are not yet settled by the *end of the day*.
I.e., how many contracts are held that have not yet found the opposite side, a buyer for a seller or a seller for a buyer.
Defines how many contracts are not yet settled by the *end of the day*.
I.e., how many contracts are held that have not yet found the opposite side, a buyer for a seller or a seller for a buyer.

Therefore, any contracts that are open are being held by someone, somewhere.
OI changes as contracts are written to those who hold them, either buying or selling, and the number does not differentiate a side!
OI does not show the number of times a contract has been purchased!
OI changes as contracts are written to those who hold them, either buying or selling, and the number does not differentiate a side!
OI does not show the number of times a contract has been purchased!
OI should update just before market open on your broker and the UW Flow itself.
OI DOES NOT UPDATE THROUGHOUT THE DAY!
OI DOES NOT UPDATE THROUGHOUT THE DAY!
Volume:
Volume are the number of contracts traded just during the day, bought or sold, to open or to close.
Again, just as with OI, volume in no way reveals to us a side taken, direction, or otherwise!
Volume are the number of contracts traded just during the day, bought or sold, to open or to close.
Again, just as with OI, volume in no way reveals to us a side taken, direction, or otherwise!
Floor Volume:
This appears to be the percentage of floor trades on the chain.
Floor traders work on the floor of an exchange and when they execute a trade it must be reported on an exchange by the "floor" tag.
Please read my thread on floor traders here:
This appears to be the percentage of floor trades on the chain.
Floor traders work on the floor of an exchange and when they execute a trade it must be reported on an exchange by the "floor" tag.
Please read my thread on floor traders here:
https://twitter.com/Crowd_Traders/status/1476598973347643397

Premium Sides:
This is a small comparator showing the number of trades at the ask (green) versus the bid (red).
Read more about how a put can be bullish and a call bearish in my thread here:
This is a small comparator showing the number of trades at the ask (green) versus the bid (red).
Read more about how a put can be bullish and a call bearish in my thread here:
https://twitter.com/Crowd_Traders/status/1476735922939080712

If you see calls at the bid, they are SOLD calls, either exiting the chain altogether or sell the call short. You'll need to do more DD in the Flow to figure out which!

That concludes the rundown of the new @unusual_whales Hottest Chains and Tickers page.
Please, let me know if these guides are useful to you.
P.S. I know lots of folks prefer videos, too, so if you want to assist me in turning my threads into videos, please reach out in my DMs.
Please, let me know if these guides are useful to you.
P.S. I know lots of folks prefer videos, too, so if you want to assist me in turning my threads into videos, please reach out in my DMs.
• • •
Missing some Tweet in this thread? You can try to
force a refresh