Scotland: 2022 mortality through week 02 (NRS) scottishunity.org/scotland-morta…
If record summer excess was not caused by restricted healthcare... what caused it?
If record summer excess WAS caused by restricted healthcare…why has the excess stopped? Healthcare still restricted.
🤔
• • •
Missing some Tweet in this thread? You can try to
force a refresh
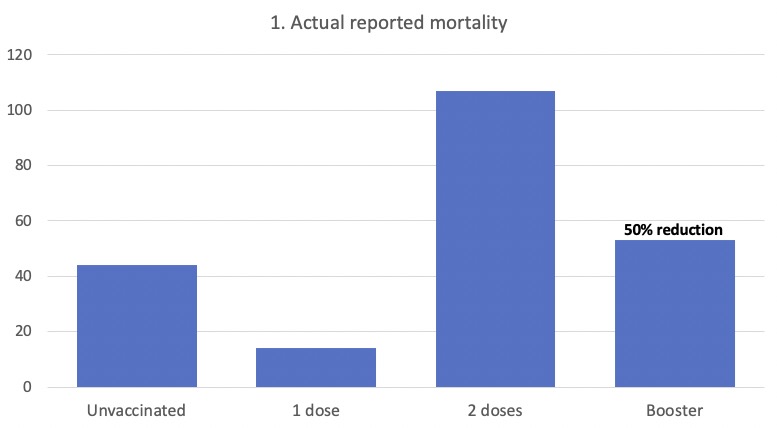
COVID mortality, 4 ways. 1/ PHS published their weekly report, one of the datasets is ‘covid deaths’ over the last 4 weeks. What could be simpler?
The raw numbers look like this. We can see double-vaccinated is highest, and ‘Booster’ 50% lower.
2/ The raw data fails to account for the population numbers of each - so we can divide deaths by population, to get a mortality rise for each cohort.
Booster is largest population, and risk looks lower, 75% down. Unvaccinated notably lower risk than 1 or 2 dose
3/ The above doesn’t account for age, so ‘age-standardised mortality’ is estimated, the 95% confidence areas below. This hugely raises the risk of 2 doses, and collapses for ‘Boosted’. This appears an artefact of (inappropriately?) considering when someone is ‘Boosted’.
Scotland: 2021 mortality through week 46 (NRS)
Week 45 was revised up to +21% from the five year average, and Week 46 initially at 11%.
Now 26 consecutive weeks, but good to see a lower number. scottishunity.org/scotland-morta…
Scotland: 2021 mortality through week 43 (NRS) 1/ Overall
Yet another really high week.
Week 42 was revised up to being +25% from the 5yr average, and this week is +26% (+272 additional deaths). 23rd consecutive week of excess - the longest bad streak on record.
2/ Excess by cause
The majority continues to be non-covid as we’ve been seeing since the start of summer, but ‘covid deaths’ (death by any cause within 28 days of a positive test) making up a sizeable amount, as has been the case recently
2b/ Excess by cause
Breaking this down, we see weekly and cumulative excess for each cause.
Several notable points, especially sharp inflection in heart/stroke from a pre-summer plateau.
Scotland: 2021 mortality through week 42 (NRS) 1/ Overall
Again a very high week, +252 from the 5 year average, which is 24% excess. Now 22 consecutive weeks of excess mortality, but also where i) it’s summer, and ii) the trend is still elevating.
(2020 included for reference)
1b/ Overall
For context this shows ‘winter mortality’ (weeks 27-42) of each of the last 30 years, ranked. This year 2021-22 is the worst position we’ve seen up until this time of year.
1c/ Overall
Another way to view, is annualising the weekly numbers - this would normally rise into winter, then settle down, with between 0.99% and 1.19% sadly passing away each year.
This 2021-22 period through week 42 is highest, & trending away from the others (getting worse)
Scotland: 2021 mortality through week 41 (NRS) 1/ Overall
Sadly another high week. Week 40 was revised up (+32% from 5yr), and week 41 was +23%.
Having been below normal in spring, now 21 consecutive weeks not only above the 5 year average, but ever higher above.
2/ Rank
With data context is always critical, and we should be clear neither this (nor indeed 2020) are anything not experienced before. 2021 to date ranks 11th in mortality rate in even the past 30 years. The key is the big rise from last summer.
(No need to mention the 90s!)
3/ Excess mortality by cause
‘Deaths within 28 days of a positive test’ continues to make up a notable proportion of the excess, albeit less than 50%. Those numbers - both total excess and 'with covid’ - are far higher than the corresponding period last year.