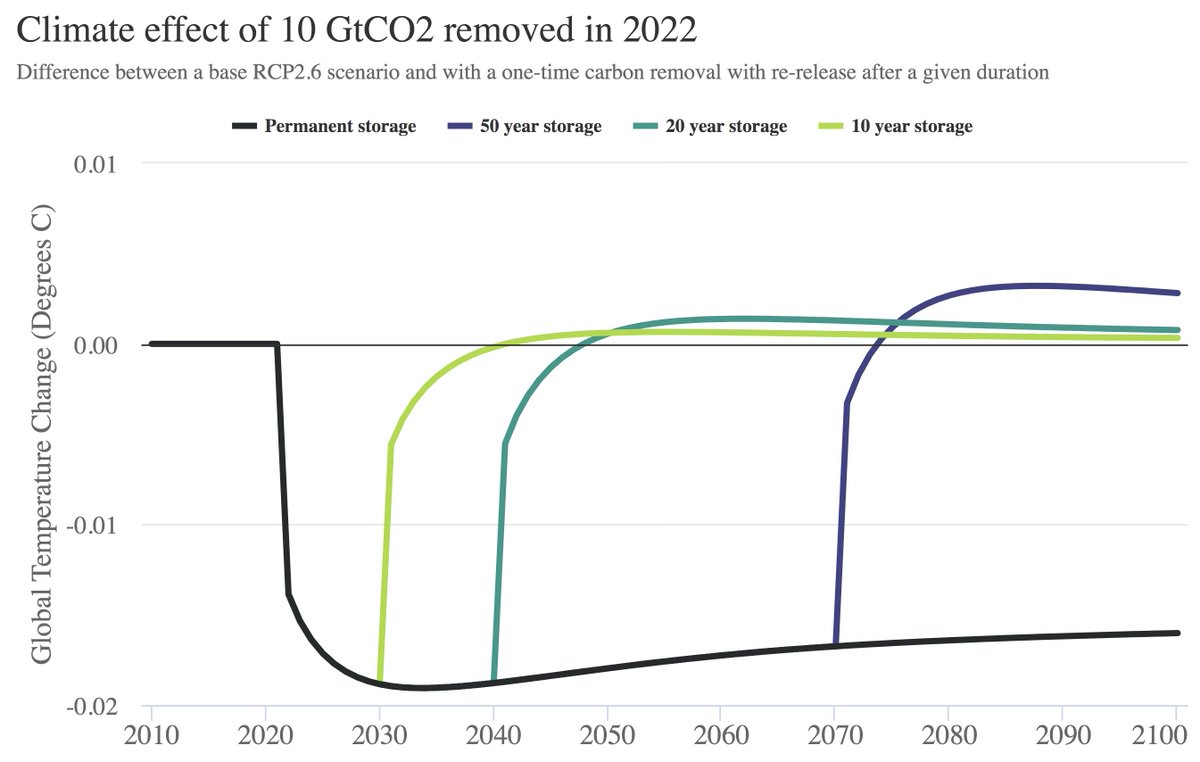
Carbon removal is important, but how long it stays out of the atmosphere makes a big difference on resulting climate impacts. Here are the results of a simple climate model simulating a one-time removal of 10 GtCO2 in 2022, which is stored for 10, 20, 50, or 100+ years:
The figure shows the difference between a deep mitigation scenario (RCP2.6) with and without 10 GtCO2 removed in 2022, which is then re-released after a given period. There are a few interesting dynamics at work here.
Once the CO2 is re-released the climate quickly warms in response, though its buffered a bit by ocean heat uptake times. Somewhat counterintuitively, after re-release we actually end up with more more long term warming than if the CO2 had never been captured in the first place.
This is because the temporary period of lower atmospheric CO2 concentrations results in lower natural carbon sink (e.g. both land and ocean) uptake, as carbon uptakes increase proportionately with atmospheric concentrations.
This does not necessarily mean that temporary storage is valueless (or actively counterproductive). For example, temperatures peak in the 2070s in RCP2.6, so temporary storage past that peak could effectively lower peak warming (and associated risks).
So why consider temporary storage? Well, most of the carbon removal done today stores carbon in the biosphere (e.g. in the form of trees). This is necessarily somewhat temporary, as trees die and there is no guarantee regions will remain forested in perpetuity.
There are real risks to permanence for biosphere storage in a warming world; for example, many of the wildfires burning through California this year were in forest areas set aside for carbon offsets. Other risks may also grow as the climate warms, e.g.: wildfiretoday.com/2021/12/27/war…
Permanent carbon removal through geologic storage/mineralization is the gold standard, but its prohibitively expensive in most cases (e.g. ~$600/ton) today (though costs are falling). As we move toward a world with more CDR, we need to be willing to pay a premium for permanence.
While it does a good job of emulating the warming projections of more complex ESMs, its use of impulse response functions to represent the carbon cycle introduces some limits.
One small correction: the initial graph was simulating a removal of 10 GtC, not 10 GtCO2. I had forgotten that the RCP2.6 emissions input file I was using was in C rather than CO2 when perturbing them. But the shape of the curves is accurate for any given removal quantity.
• • •
Missing some Tweet in this thread? You can try to
force a refresh
Many countries have adopted net-zero commitments later this century. In most cases these apply to all GHGs, not just CO2, and are structured using 100-year global warming potentials (GWP-100).
It turns out this choice effectively commits countries to a lot of carbon removal. 1/
If you add together different GHGs using GWP-100 it does a pretty poor job of simulating actual warming. It conflates flow pollutants (like CH4) with stock pollutants (like CO2) in ways that are unhelpful, as I discussed last year in this thread:
While we can get close to zero CO2 emissions (at least in theory), it will be much harder to remove all the CH4 and N2O emissions from agriculture. This means that a zero-GHG target is actually a negative-CO2 target, where CO2 removal is balancing out remaining CH4 and N2O.
⬆ 5th or 6th highest surface temps
⬆ Warmest summer on land
⬆ Warmest year for 25 countries + 1.8 billion people
⬆ Record ocean heat
⬆ Record high GHGs
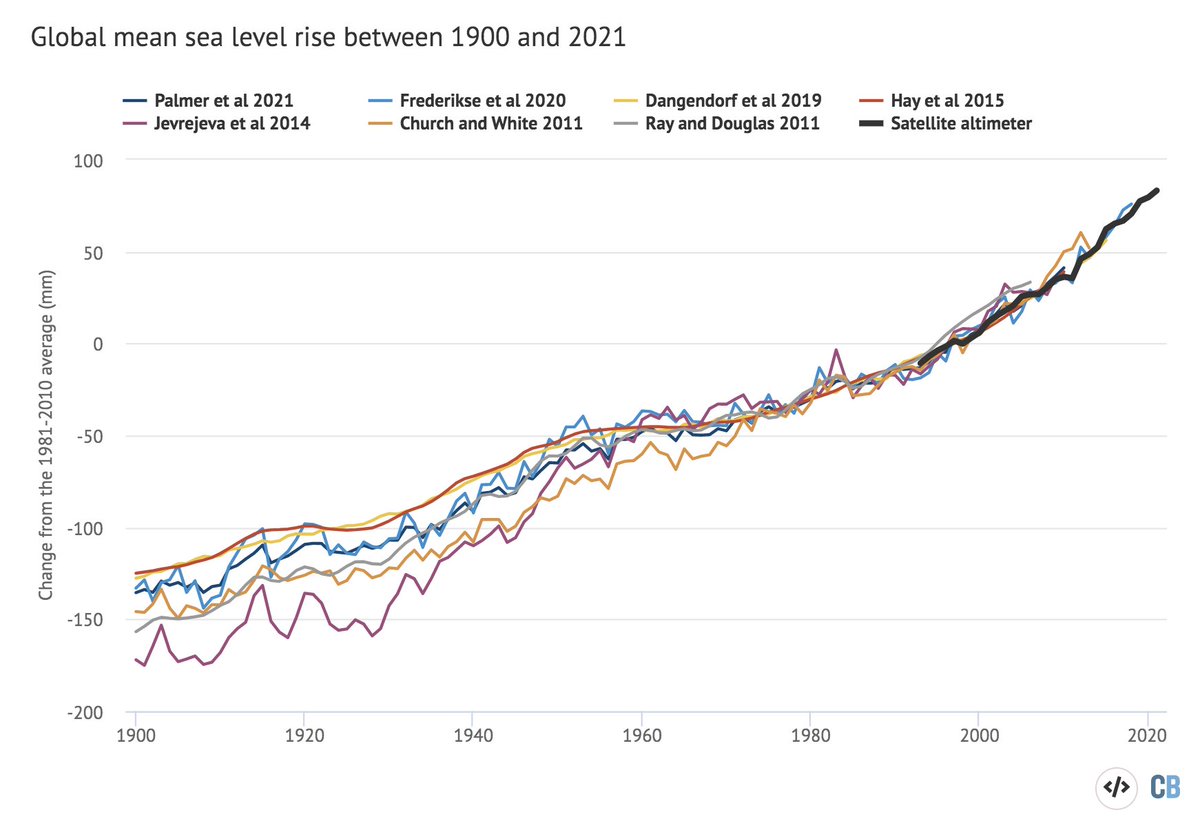
⬆ Record high sea levels
⬇ Record low glacier mass
1/18
2021 was a bit cooler than the last few years due to a moderate La Nina event. La Nina tends to result in cooler temps globally, though the global response tends to lag 3-4 months after peak conditions. Here is what global temps look like since 1970 with and without ENSO removed:
The Tonga eruption yesterday appears to be one of the largest volcanic events we have seen in decades.
We do not know how much cooling SO2 it has put in the stratosphere (data will come in later today), but this is the effect a Pinatubo-sized volcano would have on temps today:
That being said, we have no particular reason to think that this eruption will be Pinatubo-sized in terms of its stratospheric SO2 injection. That will depend on how much SO2 was released for how long how high in the stratosphere. We will know more in a day, so watch this space!
Scientists get excited about these sort of events because they can serve as natural climate experiments, but we should not lose sight of the real suffering on the ground that this event (and the resulting tsunami) have caused for people in Tonga and the surrounding regions.
Ocean heat content is our best measure of the impact of human activity on the climate; >90% of all heat trapped by greenhouse gases is absorbed by the oceans.
In 2021, we saw the warmest ocean heat content since records began, >400 billion trillion joules higher than the 1940s.
This is from the newly released dataset by @Lijing_Cheng and the Institute for Atmospheric Physics, though NOAA's ocean heat content record shows similar results: link.springer.com/article/10.100…
For more details on surface and atmospheric temperatures, ocean heat, sea level rise, atmospheric GHGs, sea ice, and other climate indicators in 2021 see our @CarbonBrief state of the climate analysis coming out in the next few days.
I'm used to foolish and misguided attempts at blaming climate scientists for society not having effectively dealt with climate change.
But suggesting that a solution is for climate scientists to strike and stop doing science is a supernova of stupid: tandfonline.com/doi/full/10.10…
I'm sure politicians will finally get on to putting effective climate policy into place if only they didn't have those pesky IPCC reports warning them of the dire risks of inaction...
I'm also sure that all of the climate scientists who are not old tenured white dudes would also love the career advancement that comes from refusing to do work...
El Nino and La Nina (ENSO) are main drivers of year-to-year variability in global temperatures, on top of the long-term human-caused warming trend.
Here is what happens if we use statistics (following @rahmstorf and Forster 2011) to remove their effects from @CopernicusECMWF:
And here is what the recorded temperatures (red) look like compared to these ENSO-removed variants:
Its interesting (and somewhat coincidental) that 2021 still ends up as the 5th warmest year even when ENSO effects are removed, but its much closer to the past few years, and the long-term warming trend even clearer without ENSO.