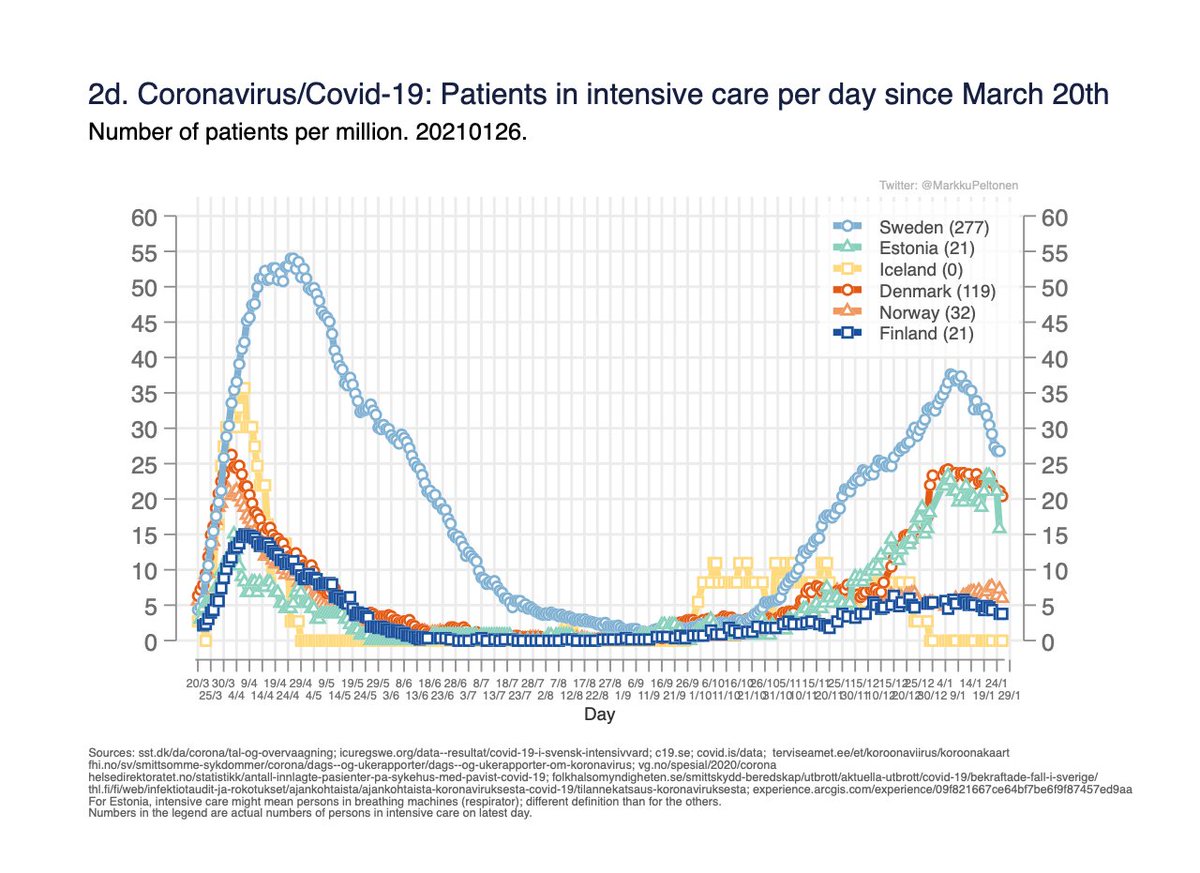
Patients in intensive care due to Covid-19 in the Nordics and the Baltics 21.1. 1/4
Tehohoito Pohjoismaat Baltia. #koronafi
Tehohoito Pohjoismaat Baltia. #koronafi


Patients in hospital care due to Covid-19 in the Nordics and the Baltics. 2/4
Sairaalahoito Pohjoismaat Baltia.
Sairaalahoito Pohjoismaat Baltia.


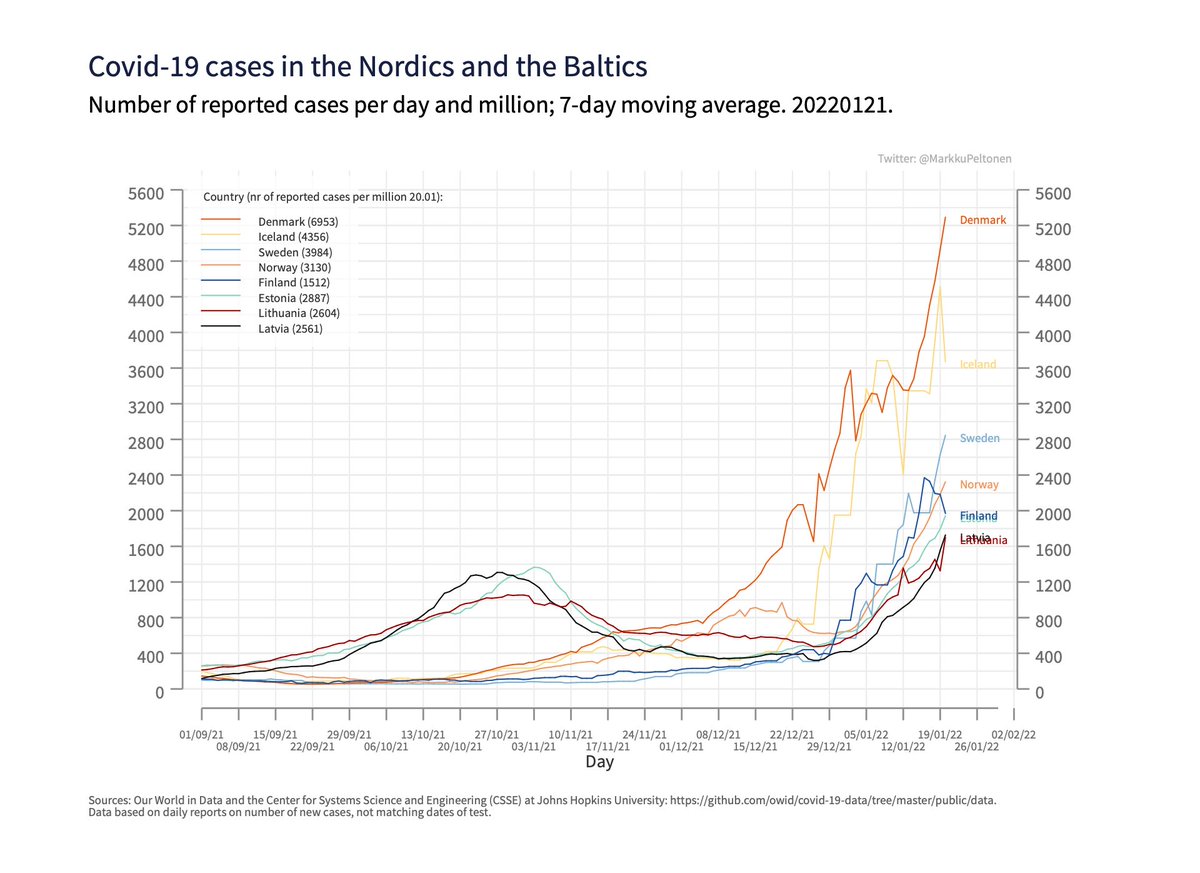
Covid-19 cases in the Nordics and the Baltics. Different testing practices affect this. 3/4
Tapausmäärät Pohjoismaat ja Baltia. Testauskäytännöt vaihtelee.
Tapausmäärät Pohjoismaat ja Baltia. Testauskäytännöt vaihtelee.
Finland, Covid-19 cases regionally. 4/4
Suomi tapausmäärät alueellisesti.
Suomi tapausmäärät alueellisesti.

Finland, Covid-19 cases regionally (hospital districsts)
Suomi tapausmäärät alueellisesti (sairaanhoitopiirit).
Suomi tapausmäärät alueellisesti (sairaanhoitopiirit).

Good news, got my 3rd Covid-19 vaccine dose this morning!
Enjoy your weekend!
Hyviä uutisia, triplasti rokotetta nyt kropassa. Rokotteet kannattaa ottaa.
Hyvää viikonloppua!
Enjoy your weekend!
Hyviä uutisia, triplasti rokotetta nyt kropassa. Rokotteet kannattaa ottaa.
Hyvää viikonloppua!

• • •
Missing some Tweet in this thread? You can try to
force a refresh