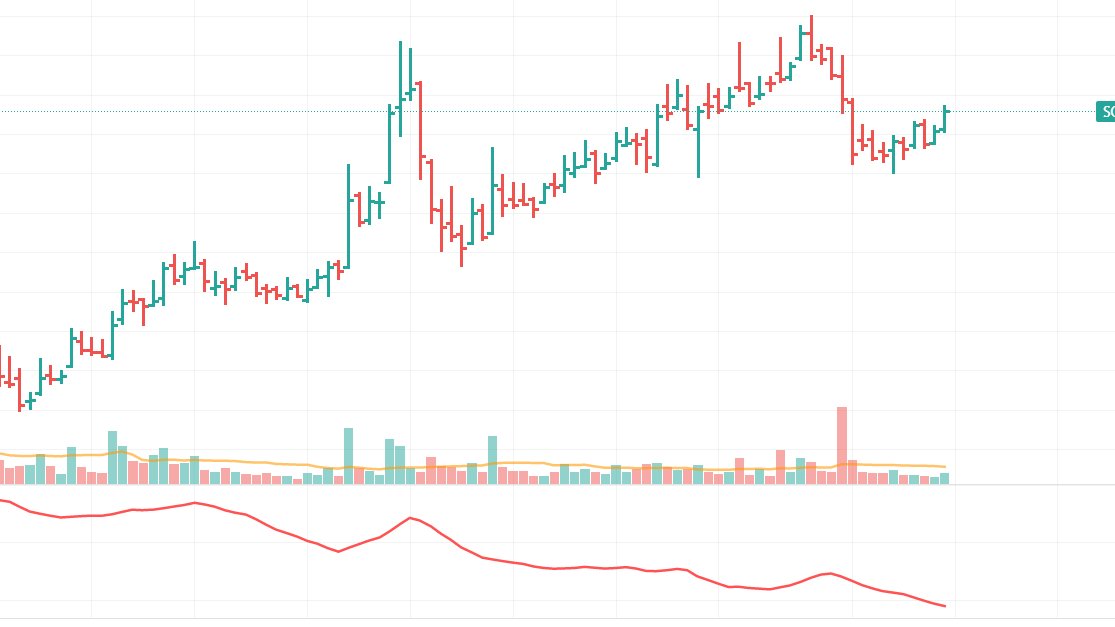
A thread of threads on 3 indicators

1. Moving Averages Ultimate Guide
2. All About ADX
3. Super Performance Using RELATIVE STRENGTH

Retweet and Share

• • •

Missing some Tweet in this thread? You can try to force a refresh
 

Keep Current with JayneshKasliwal

JayneshKasliwal Profile picture

Stay in touch and get notified when new unrolls are available from this author!

Read all threads

This Thread may be Removed Anytime!

PDF

Twitter may remove this content at anytime! Save it as PDF for later use!

Try unrolling a thread yourself!

how to unroll video
  1. Follow @ThreadReaderApp to mention us!

  2. From a Twitter thread mention us with a keyword "unroll"
@threadreaderapp unroll

Practice here first or read more on our help page!

More from @JayneshKasliwal

Jan 22
Breakout Trading Strategy

How to Trade Breakouts Effectively?
How to Avoid Big losses in Failures ?
What to Look before entering into Breakouts?

A THREAD🔖
Retweet And Share 🔄
1/n
What is Breakout ?
A breakout is a stock price moving outside a defined support or resistance level with increased volume.
Always trade breakouts in uptrend for high win ratios
Source : Google
1/n Image
What to Look before entering a breakout ?
Look for Volume Spikes on Up days and Down Volume on down days.
Simply Volume Should Dry during Pullbacks
This is a sign of Accumulation by Bigger Sharks.
As they buy in huge quantities they have to buy in parts to avoid price spikes
2/n Image
Read 12 tweets
Jan 19
200 EMA Reversal Strategy for Positional Trading
A Short Thread 🔖

✅Covering Price Action
✅How to identify the trend
Retweet And Share !
200 EMA : THE LONG TERM TREND
1.When a stock price crosses its 200-day moving average, it is a technical signal that a reversal has occurred.
2. A stock above 200 ema is considered bullish in its long term trend and if its below 200 ema its considered bearish
1/n
3. A simple rule of not buying stocks below 200 ema for short term trading could save a lot of money
4. One may consider investing in stocks if the stock is below 200 ema only if he is confirmed about the fundamentals of the stock
5. Some may not agree with this and its ok!
2/n
Read 13 tweets
Jan 14
Supertrend-Relative Strength Strategy for Positional and Swing Trading

A thread 🔖
on Supertrend and Relative Strength !

Retweet and share if you find it helpful !

1/n
What is Relative Strength ?

📌Relative strength is a strategy used in momentum investing and in identifying value stocks.

📌It focuses on investing in stocks or other investments that have performed well relative to the market as a whole or to a relevant benchmark.
2/n
Conditions of Relative Strenght
Relative Strength has a reference zero line
Line >0 Stock is Outperforming
Line <0 Stock is Underperforming

RS period 65 as we have around 65 trading days in 3 month
RS reference as Nifty50 as benchmark index as
3/n
@kuttrapali26
Read 14 tweets
Jan 10
A Mega Thread on RELATIVE STRENGTH

A method to improve
Stock Selection and Conviction in trades

Retweet 🔄And Follow
@JayneshKasliwal
What is RELATIVE STRENGTH?

Relative strength is a strategy used in momentum investing and in identifying value stocks.

It focuses on investing in stocks or other investments that have performed well relative to the market as a whole or to a relevant benchmark.
1/n
For example, a relative strength investor might select technology companies that have outperformed the Nifty50, or the Nifty 500.
This is basically used for Identifying the strongest sector , stocks , asset class by comparing the relative performance
2/n
Read 25 tweets
Jan 4
A Thread of all my Trading Strategies
📌Rs + Macd Strategy
📌Darvas Box Strategy
📌Breakout Trading
📌Retest Trading
📌Range Trading

Retweet and Share !
@kuttrapali26 @Techno_Charts
1/no
Read 6 tweets
Jan 1
A Thread on indicator : ADX
Average Directional Index a Quick Guide

Retweet Share !
@Techno_Charts

1/n Image
One of the best and easiest ways to increase your chances of making winning trades is to trade with the trend
The average directional movement index or ADX is an indicator that will not help you find a trend,but can show you how strong a trend is
@Puretechnicals9 @StocksNerd
2/n
What is the Average Directional Movement
Index?

1. The average directional movement index was created by J. Welles Wilder in the 1970s.

2. The ADX combines two indicators to create a smoothed moving average that is then shown on your charts.

3/n
Read 9 tweets

Did Thread Reader help you today?

Support us! We are indie developers!


This site is made by just two indie developers on a laptop doing marketing, support and development! Read more about the story.

Become a Premium Member ($3/month or $30/year) and get exclusive features!

Become Premium

Too expensive? Make a small donation by buying us coffee ($5) or help with server cost ($10)

Donate via Paypal

Or Donate anonymously using crypto!

Ethereum

0xfe58350B80634f60Fa6Dc149a72b4DFbc17D341E copy

Bitcoin

3ATGMxNzCUFzxpMCHL5sWSt4DVtS8UqXpi copy

Thank you for your support!

Follow Us on Twitter!

:(