Breakout Trading Strategy
How to Trade Breakouts Effectively?
How to Avoid Big losses in Failures ?
What to Look before entering into Breakouts?
A THREAD🔖
Retweet And Share 🔄
1/n
How to Trade Breakouts Effectively?
How to Avoid Big losses in Failures ?
What to Look before entering into Breakouts?
A THREAD🔖
Retweet And Share 🔄
1/n
What is Breakout ?
A breakout is a stock price moving outside a defined support or resistance level with increased volume.
Always trade breakouts in uptrend for high win ratios
Source : Google
1/n
A breakout is a stock price moving outside a defined support or resistance level with increased volume.
Always trade breakouts in uptrend for high win ratios
Source : Google
1/n

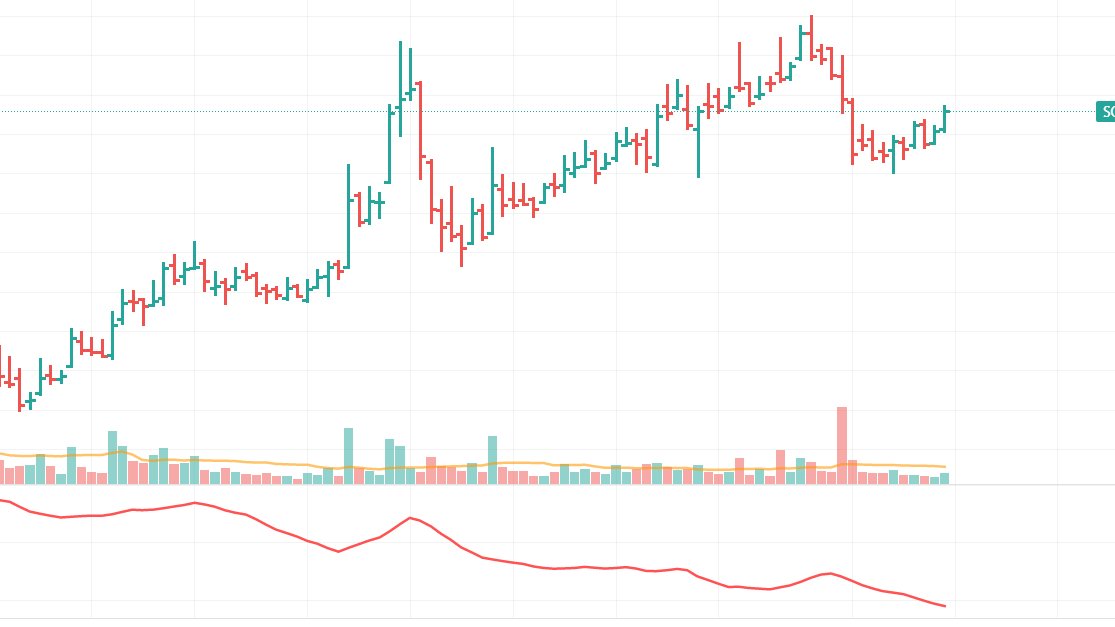
What to Look before entering a breakout ?
Look for Volume Spikes on Up days and Down Volume on down days.
Simply Volume Should Dry during Pullbacks
This is a sign of Accumulation by Bigger Sharks.
As they buy in huge quantities they have to buy in parts to avoid price spikes
2/n
Look for Volume Spikes on Up days and Down Volume on down days.
Simply Volume Should Dry during Pullbacks
This is a sign of Accumulation by Bigger Sharks.
As they buy in huge quantities they have to buy in parts to avoid price spikes
2/n

They dont only buy on Uptrend but continue holding during pullbacks for bigger gains .
Important thing is pullbacks should always have less volumes .
3/n
Important thing is pullbacks should always have less volumes .
3/n

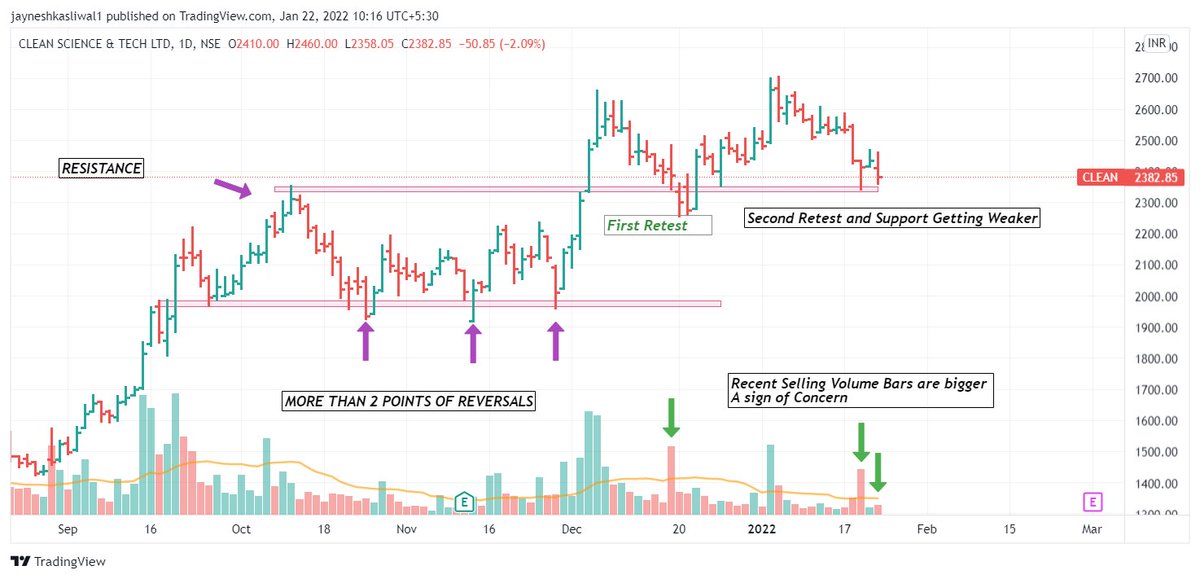
Rules For entering a Breakout .
1. Never enter more than 50 % of quantity on Breakout Region .
2. Most of the time the stock Pulls back to Breakout Region Giving a Good Reward opportunity.
3. Use Alerts to buy exactly at Pivot Points / breakout Regions to avoid extended stocks
4/
1. Never enter more than 50 % of quantity on Breakout Region .
2. Most of the time the stock Pulls back to Breakout Region Giving a Good Reward opportunity.
3. Use Alerts to buy exactly at Pivot Points / breakout Regions to avoid extended stocks
4/

4. Keeping Alerts is important and once can use @tradingview or @zerodhaonline or other Platforms to keep alerts .
5. Stock That is extended more th 4% above BO region shouldnt be bought as they dont provide Good RR .
5/n
5. Stock That is extended more th 4% above BO region shouldnt be bought as they dont provide Good RR .
5/n

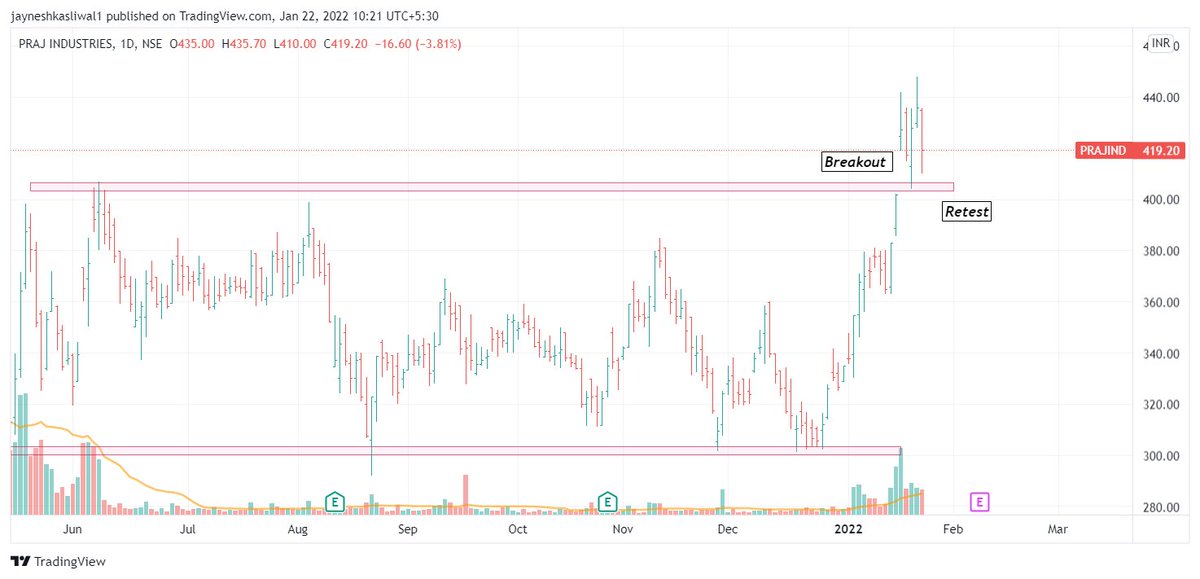
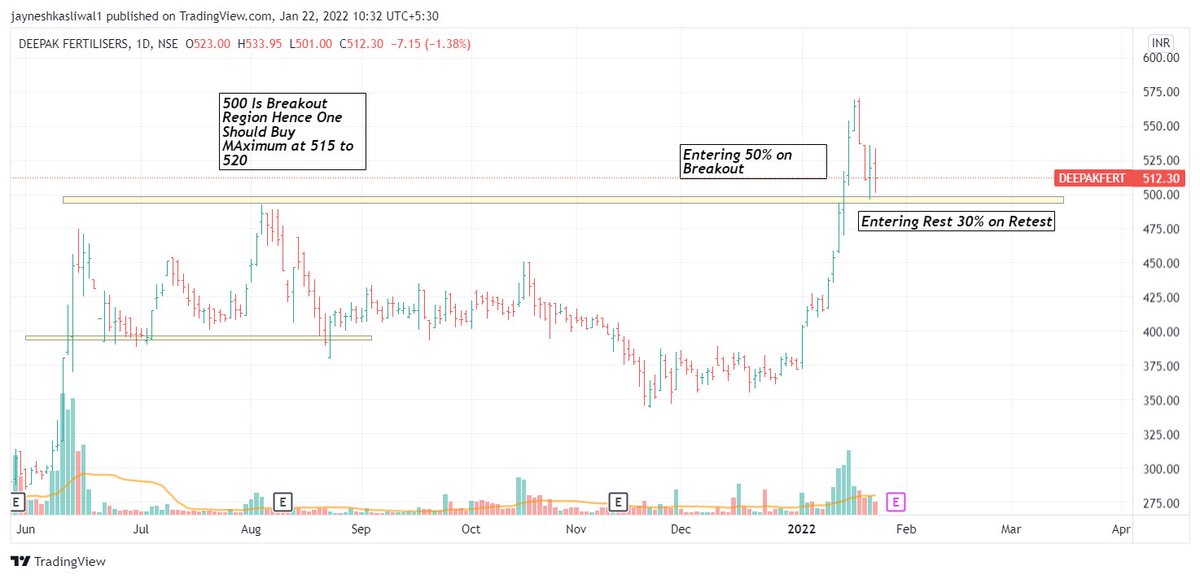
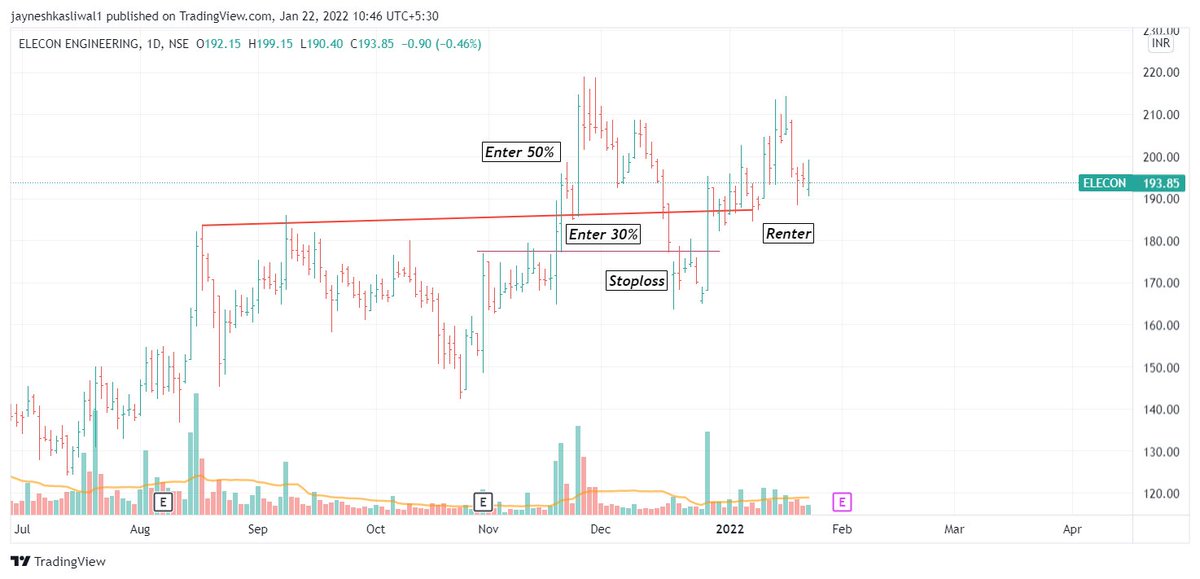
Entry Rules :
1. Enter 50% Qty on Breakout os stock
If Stoploss Hits Your Loss is only on 50%
2. Wait for Retest and add the next 30%
3. Add Further Qty on way up
4. Always add on Winners Rather than Loosers
5. Protecting Capital Is utmost imporant in this case
6/n
1. Enter 50% Qty on Breakout os stock
If Stoploss Hits Your Loss is only on 50%
2. Wait for Retest and add the next 30%
3. Add Further Qty on way up
4. Always add on Winners Rather than Loosers
5. Protecting Capital Is utmost imporant in this case
6/n
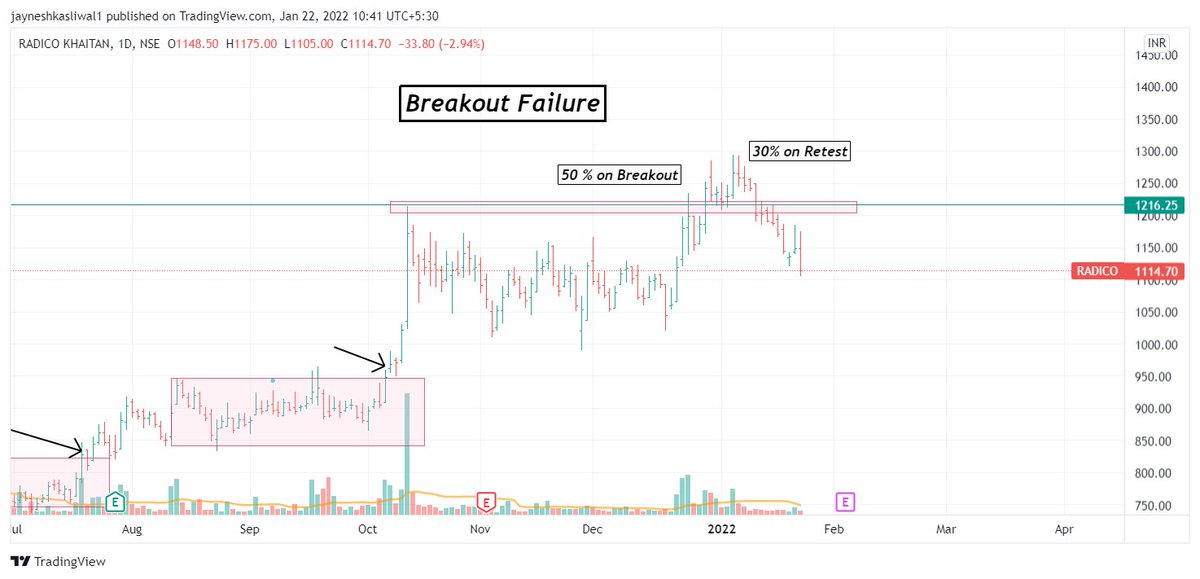
Retests Also Fail and no one can Avoid this scenarios and Loss has to be booked Definatley
Example : Radico
Look for Volume Breakouts with Price Breakouts the probability of Winning Increases
Stocks Breaking out in Uptrend have High winning Chances then in DownTrend
7/n
Example : Radico
Look for Volume Breakouts with Price Breakouts the probability of Winning Increases
Stocks Breaking out in Uptrend have High winning Chances then in DownTrend
7/n

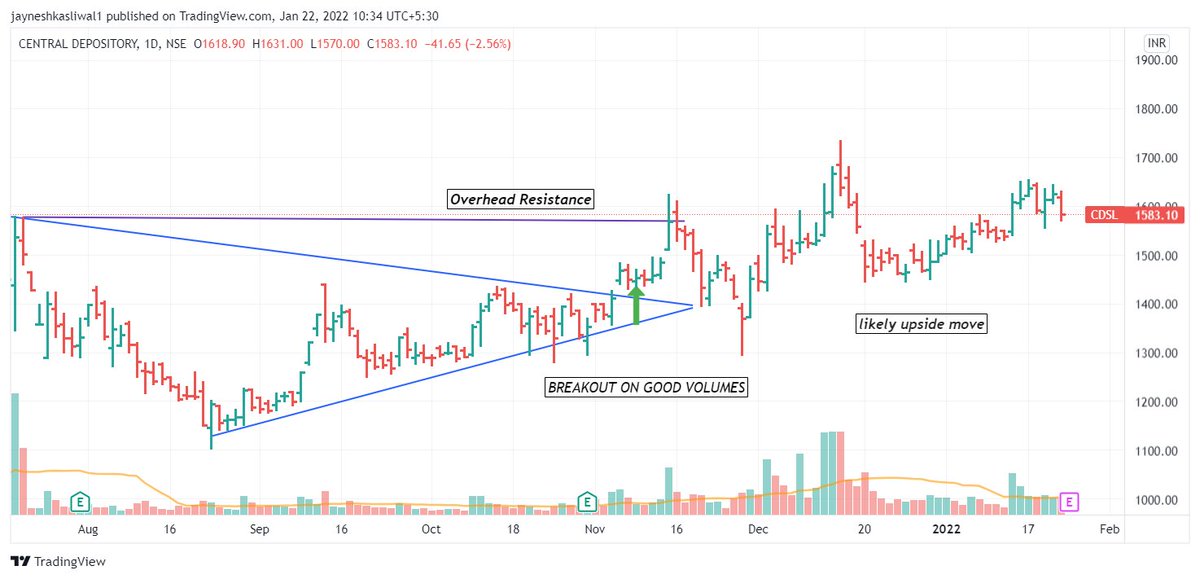
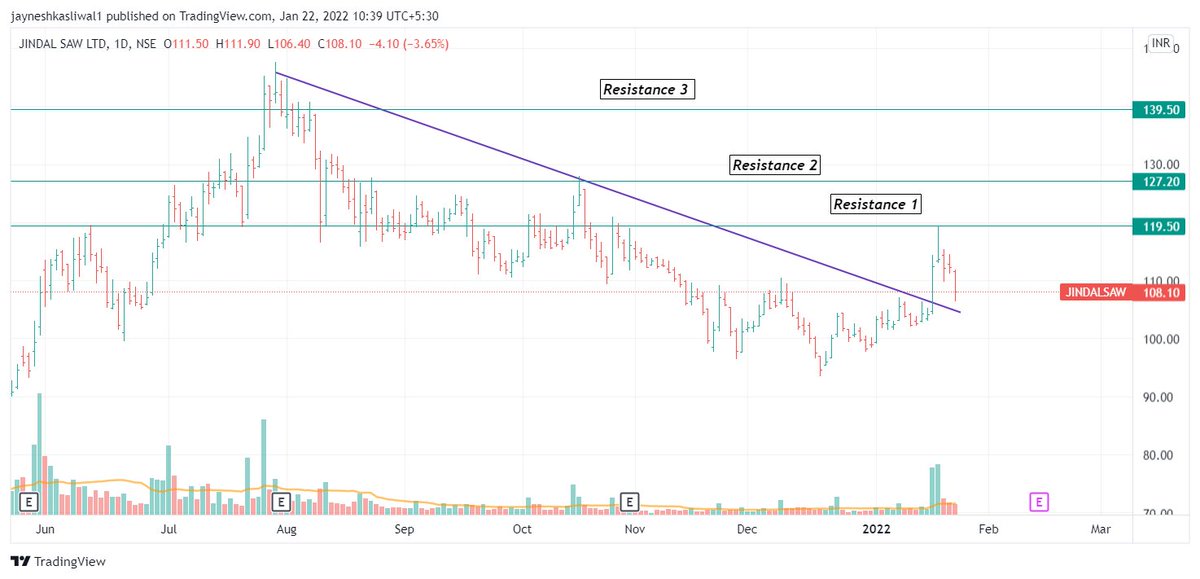
Range Breakouts VS Trendline Breakouts
Range Breakouts have Higher Winning % Compared to Traingle , Pennant Trend Breakouts due to over head Resistance .
As Buyers Are Trapped at Higher Prices they will Try to exit at every bounce at Min loss or Breakevens
Example :JindalSaw
8/n
Range Breakouts have Higher Winning % Compared to Traingle , Pennant Trend Breakouts due to over head Resistance .
As Buyers Are Trapped at Higher Prices they will Try to exit at every bounce at Min loss or Breakevens
Example :JindalSaw
8/n
Stoploss Rules :
Follow Maximum Stop of 8 to 10% in trades as Losses Work Against You .
If you are not getting Small Stop Trade move on to next trades as opportunities are endless .
Breakout Failures are common and hence Risk has to be managed
9/n
Follow Maximum Stop of 8 to 10% in trades as Losses Work Against You .
If you are not getting Small Stop Trade move on to next trades as opportunities are endless .
Breakout Failures are common and hence Risk has to be managed
9/n
Target Rules :
Target Should Be arounf 15 to 20% when your risk is 8 to 10 %
You can reduce this risk by entering at correct buy points and keeping stops at 5% .
Risk Reward of 1:2 is Great with 50% win Ratio
Book Partially at 1st targets and Keep Stop at cost.
10/n
Target Should Be arounf 15 to 20% when your risk is 8 to 10 %
You can reduce this risk by entering at correct buy points and keeping stops at 5% .
Risk Reward of 1:2 is Great with 50% win Ratio
Book Partially at 1st targets and Keep Stop at cost.
10/n
If you Liked the content Consider Following me @JayneshKasliwal to Enhance your Trading Journey
My Telegram Channel : t.me/Techno_Charts
11/n
My Telegram Channel : t.me/Techno_Charts
11/n
• • •
Missing some Tweet in this thread? You can try to
force a refresh