Latest numbers on carbon inequality by @lucas_chancel.

THREAD
Close to half of all emissions since the industrial revolution have been produced since 1990, the year of the first report by the Intergovernmental Panel on Climate Change (IPCC).
At current global emissions rates, the 1.5°C budget will be depleted in 6 years and the 2°C budget in 18 years. The per capita sustainable budget compatible with the 1.5°C limit is 1.1 tonne of CO2 per annum per person, i.e. about 6 times less than the current global average.
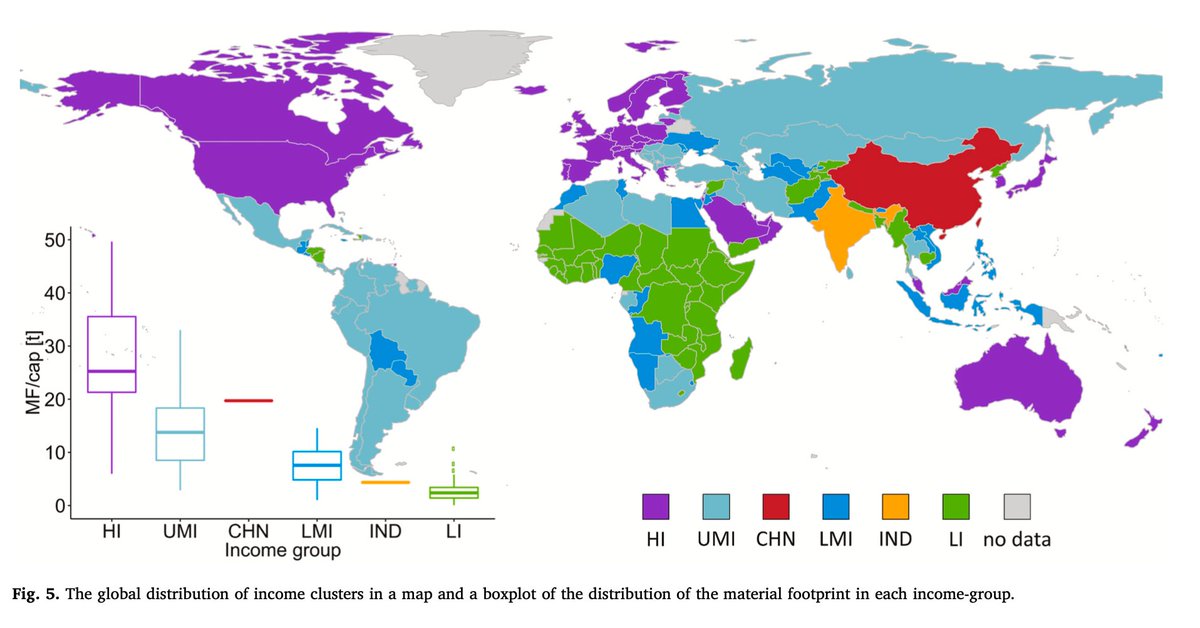
There is a close link between per capita income and emissions, but this link is not perfect: certain regions are more effective than others in limiting emissions associated with a given level of income.
Population is not the main driver of emissions.
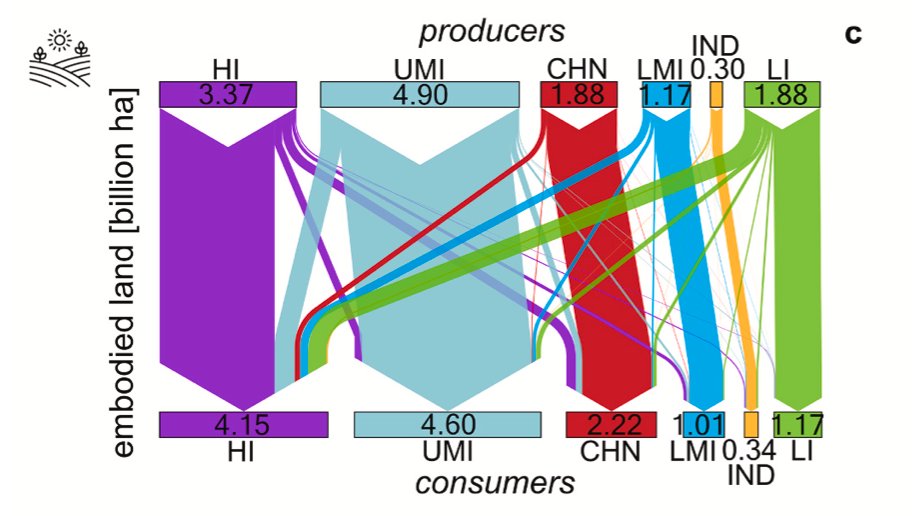
When measuring emissions, watch out for imports and exports. For example, Europe’s carbon footprint (including imported/exported emissions) is 23% higher than its territorial emissions (excluding imported/exported emissions).
Carbon inequalities within regions are even larger than carbon inequalities between regions.
The main driver of emission is wealth. At 31.2 tCO2/year/cap, the 10% global richest are responsible for nearly half of total emissions. Compare this to the poorest half of humanity who only represent 12% of total emissions.
The size of the colored areas is proportional to population, showing the extent of carbon inequality, and the fact that only a few people enjoy high-carbon lifestyles.
Since 1990, average global emissions per capita grew by about 7% (and overall emissions grew by 58%), but that average hides wide disparities.
The 10% global richest are responsible for 45% of emission growth since 1990.
Luxury emissions is not only yachts, jets, and other purchased goods and services, it’s also emissions from the assets that they own.
In 1990, carbon inequality was mostly inequality between rich, high-emission and poor, low-emission COUNTRIES. In 2019, the situation has changed: 63% of global inequality is due to differences within countries between rich, high-emission and poor, low-emission CLASSES.
In rich countries, the bottom 50% is already below the 2030 per capita target (in the US, for example), or very close to it (France). It follows that all emissions reductions efforts should be made by the top half of the distribution.
Different situation in emerging countries.
The existence of carbon inequality means we should apply different objectives and instruments to different population. To put it in a nutshell: degrowth for the rich, green growth for the poor.
For example, a steeply progressive tax rates on polluting stock ownership. Applying a 10% tax rate on the value of carbon assets owned by multimillionaires would generate $100bn per year, about 1.5 times the current estimated annual costs of adaptation for developing countries.
What these numbers show is that the global ecological crisis is not a specie-problem, as the term Anthropocene may suggest; it is rather an issue of wealth concentration where accumulation becomes the main driver of deterioration.

END THREAD/

wid.world/document/clima…

• • •

Missing some Tweet in this thread? You can try to force a refresh
 

Keep Current with Timothée Parrique

Timothée Parrique Profile picture

Stay in touch and get notified when new unrolls are available from this author!

Read all threads

This Thread may be Removed Anytime!

PDF

Twitter may remove this content at anytime! Save it as PDF for later use!

Try unrolling a thread yourself!

how to unroll video
  1. Follow @ThreadReaderApp to mention us!

  2. From a Twitter thread mention us with a keyword "unroll"
@threadreaderapp unroll

Practice here first or read more on our help page!

More from @timparrique

Jan 24
A study by @jasonhickel, Dylan Sullivan, and @huzaifazoom that quantifies drain from the global South through unequal exchange since 1960.

THREAD
In 2017, the most recent year of data, drain through unequal exchange amounted to $2.2 trillion; in other words, it was equivalent to the quantity of Northern commodities that one could buy in that year with $2.2 trillion.
Appropriation via unequal exchange increases (1) when the volume of international trade grows (extensive growth), and (2) when the price gap between North and South widens (extensive growth).
Read 10 tweets
Jan 19
This recent study by @C_Dorninger et al. shows that economic growth in high-income nations occurs at the expense of poorer countries.

THREAD
Across the embodied flows of materials, energy, land, and labor, rich countries (in purple) used more resources from a consumption perspective than they provided through production. https://www.sciencedirect.com/science/article/abs/pii/S09218
For example, high-income countries are the largest net appropriators of land (of approximately 0.8 billion hectares per year). Their land footprint correspond to 31% of total global land used. https://www.sciencedirect.com/science/article/abs/pii/S09218
Read 9 tweets
Jan 13
This study by @JefimVogel et al. (2021) shows that it is possible to satisfy human needs within a sustainable level of energy use.

THREAD/
1/ Looking at 106 countries, it analyses how the relationship between energy use and need satisfaction varies with a range of socio-economic factors relevant to the provisioning of goods and services.
2/ It looks at 6 human needs and 12 provisioning factors.
Read 12 tweets
Jan 10
If you think inequality is only a matter of income, think again – and check this study on energy inequality by @yl_oswald, @dr_anneowen, and @JKSteinberger.

THREAD/
1/ The richer a country, the bigger its energy footprint.
2/ Failure in economic inclusion causes exclusion from energy provision. Also: when expenditure is highly unequal in a country, the corresponding inequality in energy footprints will tend to be even larger.
Read 11 tweets
Dec 16, 2021
Six figures to understand carbon inequality from the World Inequality Report 2022.

THREAD/
1/ Close to half of all emissions are due to one tenth of the global population, and just one hundredth of the world population (77 million individuals) emits about 50% more than the entire bottom half of the population (3.8 billion individuals). https://wir2022.wid.world
2/ The bottom half of the global population contributed only 16% of the growth in emissions observed since 1990, while the top 1% (77 million individuals) was responsible for 21% of emissions growth. https://wir2022.wid.world
Read 7 tweets
Nov 24, 2021
Is decoupling likely to happen? To find out, here is a thread summary of my third and final lecture for The Norwegian Society for the Conservation of Nature.
(Spoiler alert: the answer is no).

THREAD/
1/ The first limit to greening growth has to do with declining rates of Energy Returns on Energy Invested (EROI), meaning that it takes more and more energy to obtain energy.
2/ And for the economists out there who will argue that the energy sector is not that important because it’s only a small part of GDP, read this paper.
Read 15 tweets

Did Thread Reader help you today?

Support us! We are indie developers!


This site is made by just two indie developers on a laptop doing marketing, support and development! Read more about the story.

Become a Premium Member ($3/month or $30/year) and get exclusive features!

Become Premium

Too expensive? Make a small donation by buying us coffee ($5) or help with server cost ($10)

Donate via Paypal

Or Donate anonymously using crypto!

Ethereum

0xfe58350B80634f60Fa6Dc149a72b4DFbc17D341E copy

Bitcoin

3ATGMxNzCUFzxpMCHL5sWSt4DVtS8UqXpi copy

Thank you for your support!

Follow Us on Twitter!

:(