Suomen epidemia 27.1.2022: positiivisten osuus nousee edelleen. Päivittäisten kuolemien määrä nousee voimakkaasti.
1/x
1/x

Käydään tätä kuvaa läpi.
- sininen viiva = THL:n virallisista luvuista laskettu positiivisten osuus, joka on 12.1. jälkeen noussut tasaista vauhtia (1.1 prosenttia päivässä = 1.4x kuukaudessa).
2/x
- sininen viiva = THL:n virallisista luvuista laskettu positiivisten osuus, joka on 12.1. jälkeen noussut tasaista vauhtia (1.1 prosenttia päivässä = 1.4x kuukaudessa).
2/x
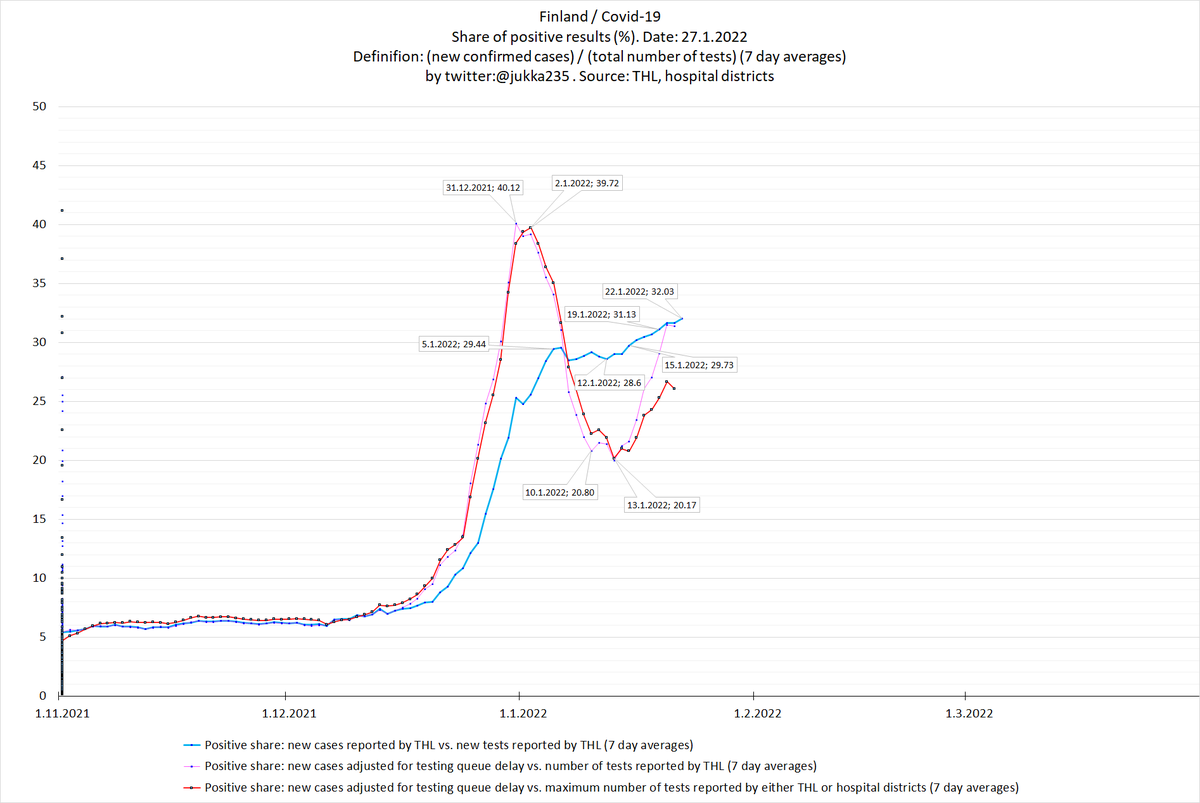
Nyt kun testien määrä on pienentynyt, näytteenoton viive on palautumassa takaisin normaalille tasolle (1-2 päivää). Sen seurauksena näytteenoton viiveellä korjatut luvut (vaaleanpunainen viiva) ovat palaamassa THL:n virallisten lukujen tasolle.
3/x
3/x

THL:lla on olemassa raportoinnin viive myös testauksessa, eli sairaanhoitopiirit ovat raportoineet testejä, joita THL ei ole vielä raportoinut (ja kun ne raportoidaan, ne kohdistetaan näytteenottopäiville).
4/x
4/x

Jos sairaanhoitopiirien raportoimat testit kohdistuvat (sitten kun THL raportoi ne) samoille päiville kuin milloin piirit ovat ne raportoineet, saadaan punainen viiva. Odotellaan kuitenkin, että THL raportoi ne (jolloin sininen viiva päivittyy).
5/x
5/x

Testien määrät on raportoitu melko kattavasti noin 21.1. saakka. Parin viime viikon aikana THL on raportoinut suuria määriä myöhässä olevia testejä perjantaisin, eli totuus tilanteesta selviää aina perjantaisin. Seurataan tilannetta.
6/x
6/x

Tässä kokonaiskuva positiivisten osuuden kehityksestä epidemian alusta saakka. 12.1. jälkeen positiivisten osuus on ruvennut nousemaan tasaista tahtia. Nopeammin leviävä Omicron BA.2 variantti ei toistaiseksi juurikaan näy sekvensoinneissa.
7/x
7/x

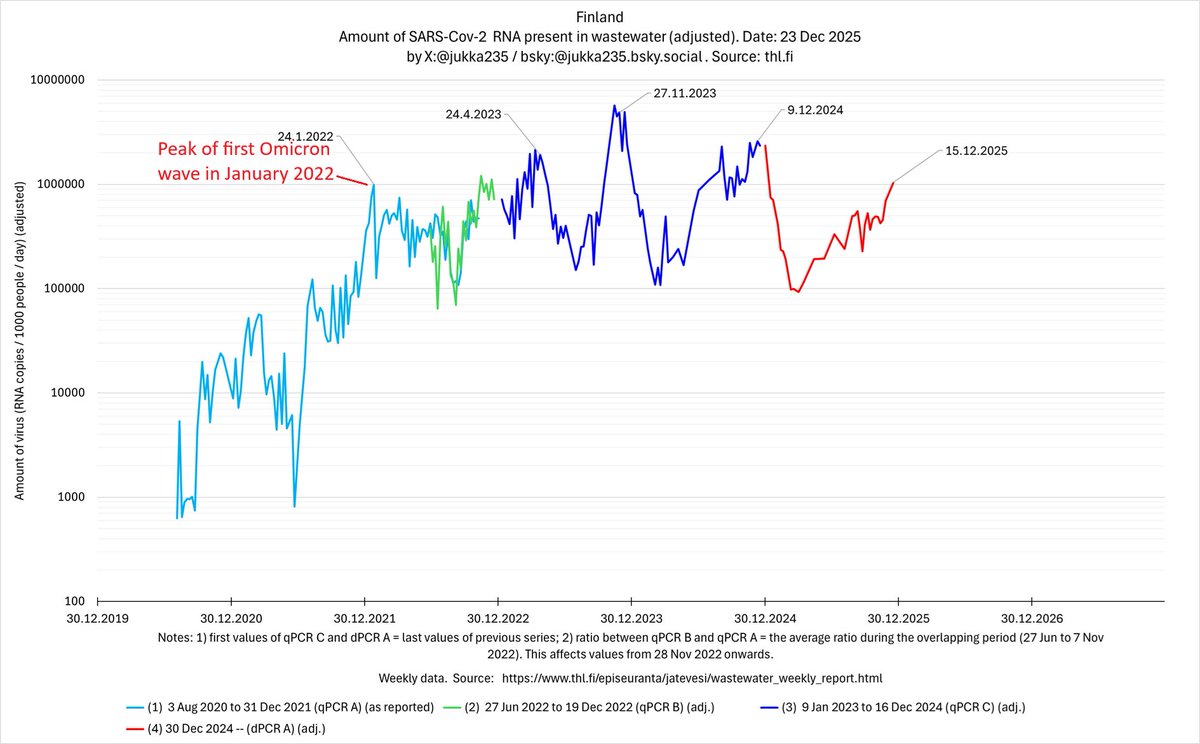
Kuvassa oleva jätevedestä mitatun viruksen määrä jatkaa nousuaan, ja on yhdessä positiivisten osuuden kanssa epidemian paras mittari. Huomenna 28.1. tulevat uudet jätevesiluvut. Tartuntojen määrään ei voi enää täysin luottaa, kun testauksen määrä vähenee.
8/x
8/x

Nimelliset luvut: tänään THL ilmoitti 6271 tartuntaa, poisti yhden, ja raportoinnin viive kasvoi 1611 tartunnalla. Sairaanhoitopiirien lukujen perusteella laskettu uusien tartuntojen määrä = 6271+1+1611=7883 (punainen viiva).
9/x
9/x

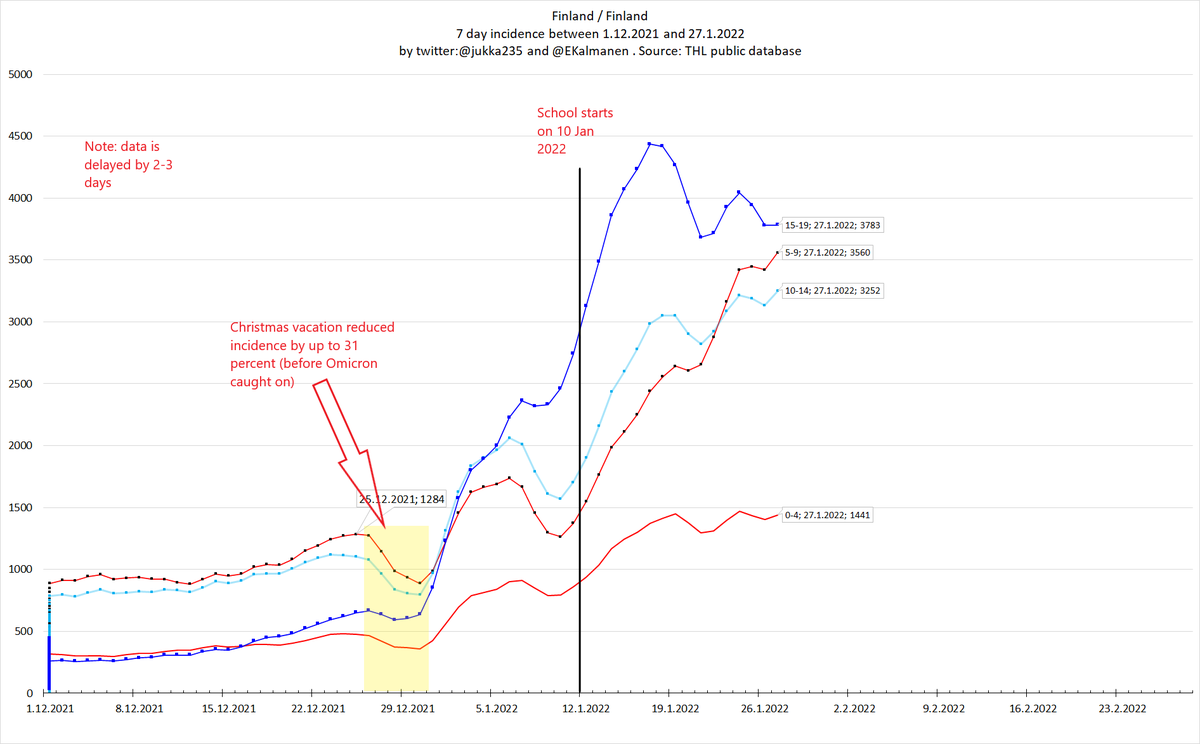
Sen jälkeen kun koulujen lähiopetus alkoi 10.1.2022, koululaisten ilmaantuvuus on kasvanut pysähtymättä siitä huolimatta, että testausta on vähennetty. Nopeinta vauhtia nousevat 5-9 -vuotiaiden tartunnat.
10/x
10/x

Tässä ikäryhmittäinen ilmantuvuuden kehitys koko maassa. Koululaisten saamien tartuntojen määrä on moninkertaistunut sen jälkeen, kun lähiopetus alkoi 10.1.2022.
11/x
#koronafi
11/x
#koronafi

Tässä sama kuva, mutta nyt vain alle 20-vuotiaiden ikäryhmät. Koulujen avaamisen jälkeen 5-9 -vuotiaiden ilmaantuvuus on 2.3-kertaistunut (kasvuvauhti 5.7% päivässä = 5.3x kuukaudessa).
12/x
12/x
Vaikka THL väittää positiivisten osuuden olevan laskussa (27.1. tilannekatsaus), niin ECDC:n mielestä positiivisten osuus on Suomessa nousussa.
13/x
thx @katikoso
ecdc.europa.eu/en/covid-19/co…
13/x
thx @katikoso
ecdc.europa.eu/en/covid-19/co…

• • •
Missing some Tweet in this thread? You can try to
force a refresh