IS 30K THE BEAR MARKET'S FLOOR?
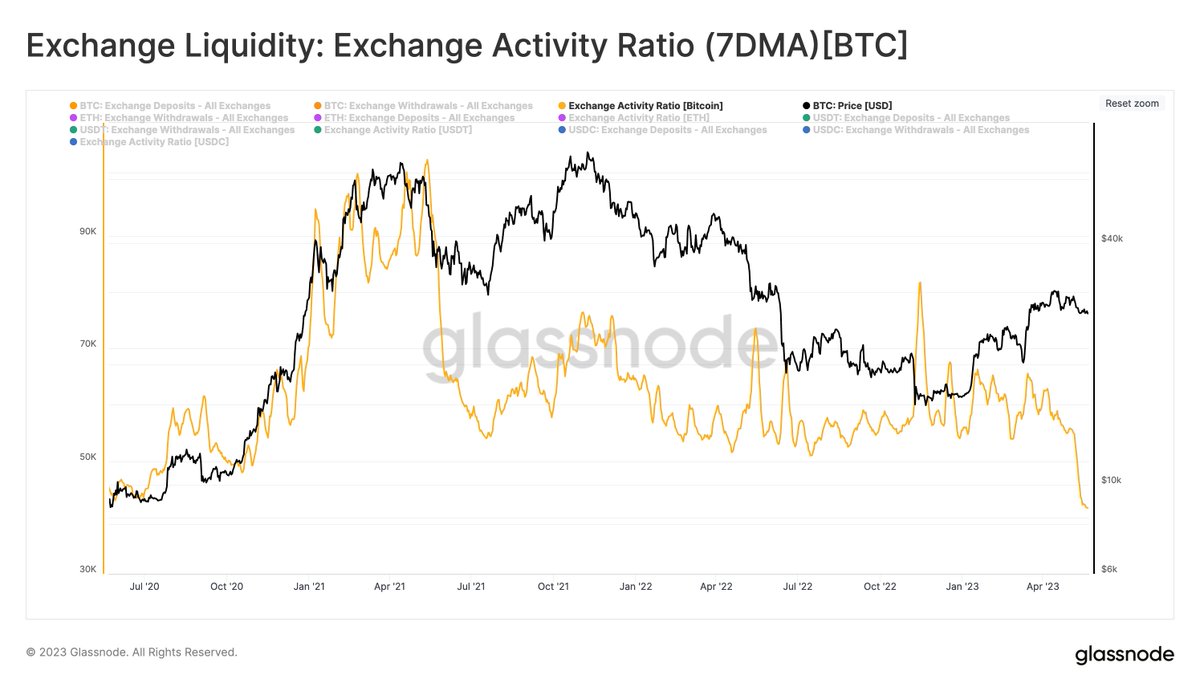
🧵/1. Looking at the Spot Exchanges (@coinbase, @binance) volume profile throughout 2021-2022, the 30K-35K price range has been a very strong demand area. A #BlackSwan " event aside, this range could be this bear market's bottom.
🧵/1. Looking at the Spot Exchanges (@coinbase, @binance) volume profile throughout 2021-2022, the 30K-35K price range has been a very strong demand area. A #BlackSwan " event aside, this range could be this bear market's bottom.

🧵/2. In 2018's bear market, which lasted 11 months, the floor price was ~ $6.4K involving multiple #DeadCatBounce with up to 80% rebounds. During this bearish phase, the % of supply in loss grew +20% due to the BUY/HODL at prices above ~$6.4K.
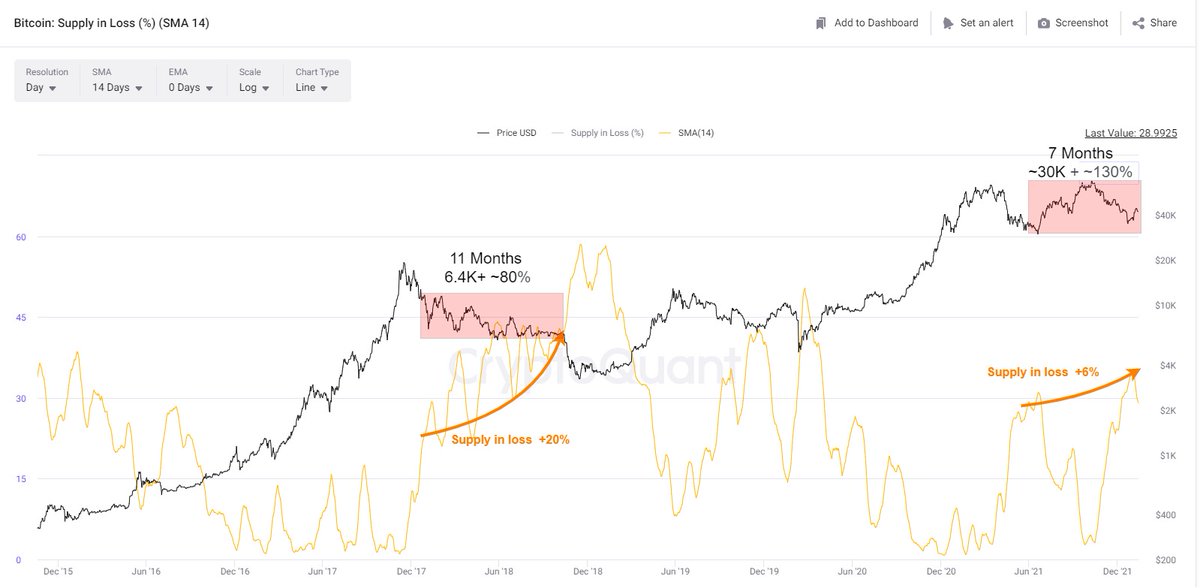
🧵/3. Assuming the second ATH was a dead cat bouns in a bear market, so far % of supply in loss has grown +6% while we had a +130% rebound to $69K. Therefore, a lengthier bear market is not out of the picture.
🧵/4. WHAT IF A #BlackSwan TAKES PLACE?
There are many possible causes for a black swan occurrence in the market. But what are the possible holding lines, assuming the historical similar events?
There are many possible causes for a black swan occurrence in the market. But what are the possible holding lines, assuming the historical similar events?
🧵/5.
A- Realized Price Multiples
The historical bottoms in the previous bear markets can be mapped using the realized price multiples. Here, the range of 0.7 to 1 X realized price multiples is presented on the charts. These levels are around 16.9K -24K, at the moment.
A- Realized Price Multiples
The historical bottoms in the previous bear markets can be mapped using the realized price multiples. Here, the range of 0.7 to 1 X realized price multiples is presented on the charts. These levels are around 16.9K -24K, at the moment.

🧵/6.
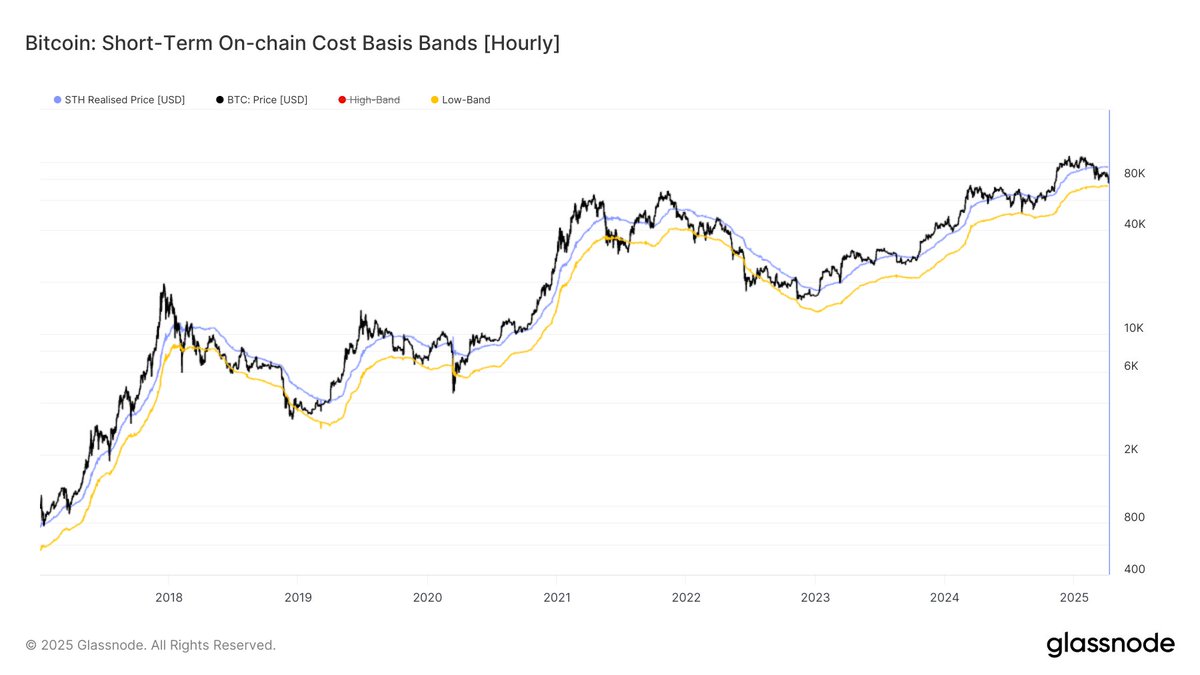
B- #MayerMultiple low band
For a nightmare scenario, my favourite bottom model is the low band of the Mayer Multiple; 0.6 X. Historically, #BTC has been lower than 0.6 * 200 MA for almost 3% of its entire history. Currently, this level is showing 29K
B- #MayerMultiple low band
For a nightmare scenario, my favourite bottom model is the low band of the Mayer Multiple; 0.6 X. Historically, #BTC has been lower than 0.6 * 200 MA for almost 3% of its entire history. Currently, this level is showing 29K

🧵/7.
C. 🐳's MVRV
Thanks to my genius friend @bullfromsea, we can track the macro bottoms, using the MVRV of 🐳. Looking at the historical trend the 0.7-0.9 levels have signalled the macro bottoms. Considering the 🐳RP (~ 24.1K), the 16.9K-21.1K levels are possible outcomes.
C. 🐳's MVRV
Thanks to my genius friend @bullfromsea, we can track the macro bottoms, using the MVRV of 🐳. Looking at the historical trend the 0.7-0.9 levels have signalled the macro bottoms. Considering the 🐳RP (~ 24.1K), the 16.9K-21.1K levels are possible outcomes.


• • •
Missing some Tweet in this thread? You can try to
force a refresh