
#BTC #Bitcoin #OnChain 📉📈
📊 Taker BUY/SELL Ratio by @cryptoquant_com 🌐
1/4
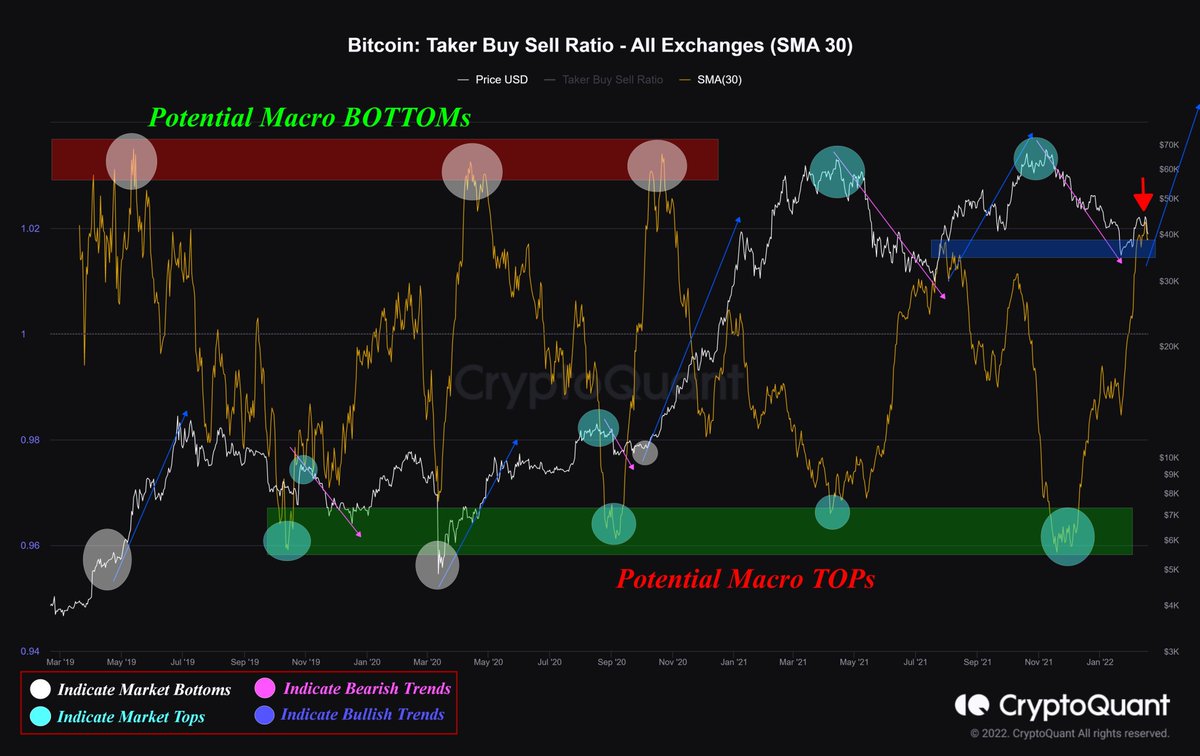
👉 If we look at the Taker Buy Sell Ratio through the 30D MA, we can see 2 significant zones:
🟢Zone for potential market TOPs
🔴Zone for possible market BOTTOMs
.../👇👇
📊 Taker BUY/SELL Ratio by @cryptoquant_com 🌐
1/4
👉 If we look at the Taker Buy Sell Ratio through the 30D MA, we can see 2 significant zones:
🟢Zone for potential market TOPs
🔴Zone for possible market BOTTOMs
.../👇👇
2/4
Neither the CRASH of May nor this Bearish trend could get close to the RED zone, from which two can be deduced:
1. Indicates that there may be more room to fall to reach the potential floor and this criterion can reach the red zone
.../👇👇
Neither the CRASH of May nor this Bearish trend could get close to the RED zone, from which two can be deduced:
1. Indicates that there may be more room to fall to reach the potential floor and this criterion can reach the red zone
.../👇👇
3/4
2. Like the BOTTOM of 28K that hasn't reached to the RED zone and fall back, BUT made the price to grown to 69K, start a bullish trend again.
However, the main point is that considering that the $BTC couldn't see below 28K, but this Metric is higher than that MAY CRASH, .../
2. Like the BOTTOM of 28K that hasn't reached to the RED zone and fall back, BUT made the price to grown to 69K, start a bullish trend again.
However, the main point is that considering that the $BTC couldn't see below 28K, but this Metric is higher than that MAY CRASH, .../
4/4
/... & this shows a BULLISH divergence in my opinion.
The common point : as the MVRV showed, we are in the "opportunity" range, and this review model shows that we are in the valuable BUYING range. So IMO #DCA is the KEY.
Thanks to @cryptoquant_com for the DATA 🌐
/... & this shows a BULLISH divergence in my opinion.
The common point : as the MVRV showed, we are in the "opportunity" range, and this review model shows that we are in the valuable BUYING range. So IMO #DCA is the KEY.
Thanks to @cryptoquant_com for the DATA 🌐
• • •
Missing some Tweet in this thread? You can try to
force a refresh


