
1.
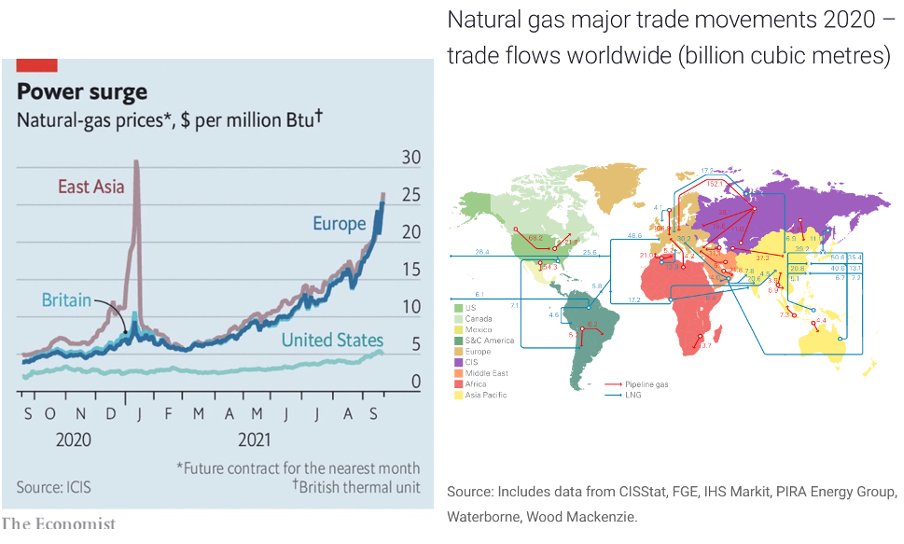
Graph on left (from Economist) is used by minority who want UK to copy US #fracking. But it actually tells a different story, linked to map on right (by BP).
Key point: US is connected to global #gas market, but is cushioned by geography that cannot apply to UK.
THREAD
Graph on left (from Economist) is used by minority who want UK to copy US #fracking. But it actually tells a different story, linked to map on right (by BP).
Key point: US is connected to global #gas market, but is cushioned by geography that cannot apply to UK.
THREAD
2.
If you think about it, the implication made by some about US shale is obviously mistaken. In reality, US gas producers would sell into EU and Asian market if they could because the price is higher. And this would push up the price that US customers had to pay - it already has.
If you think about it, the implication made by some about US shale is obviously mistaken. In reality, US gas producers would sell into EU and Asian market if they could because the price is higher. And this would push up the price that US customers had to pay - it already has.
3.
To sell into European and Asian markets, US gas producers have to use #LNG trade that links regional markets into a quasi-global market. Limited LNG capacity means that sales from US to Europe and Asia are low – and not likely to become substantial.
To sell into European and Asian markets, US gas producers have to use #LNG trade that links regional markets into a quasi-global market. Limited LNG capacity means that sales from US to Europe and Asia are low – and not likely to become substantial.
4.
The map shows that US LNG provided only 25.6bcm to Europe in 2020. This contrasts with European imports of 111bcm from Norway and 195.4bcm from Russia – the vast majority via pipelines rather than LNG ships.
bp.com/en/global/corp…
The map shows that US LNG provided only 25.6bcm to Europe in 2020. This contrasts with European imports of 111bcm from Norway and 195.4bcm from Russia – the vast majority via pipelines rather than LNG ships.
bp.com/en/global/corp…

5.
So US producers have to sell mostly into N. American market. That unique situation of gas large production, large gas market and limited export capacity keeps US prices lower. This combo can't be replicated in UK, so we couldn't magically get to US prices shown on the chart.
So US producers have to sell mostly into N. American market. That unique situation of gas large production, large gas market and limited export capacity keeps US prices lower. This combo can't be replicated in UK, so we couldn't magically get to US prices shown on the chart.
6.
However, even small amount that US can export links it to the global market. The chart shows that US gas prices followed same basic trends, and doubled by Q3 2021 – which must have shocked consumers who’d been told that #shale gas would give abundant cheap energy.
However, even small amount that US can export links it to the global market. The chart shows that US gas prices followed same basic trends, and doubled by Q3 2021 – which must have shocked consumers who’d been told that #shale gas would give abundant cheap energy.

7.
If US gas producers were able to sell more gas via LNG trade, they would – and that would raise price for N. American consumers even further.
If US gas producers were able to sell more gas via LNG trade, they would – and that would raise price for N. American consumers even further.
8.
The UK has major pipeline interconnection in the European market. So if* any gas was fracked in UK, it could be sold into Europe at European prices – that's just financial logic for gas producers.
* We know that UK fracking would be difficult & costly.
eciu.net/insights/2021/…
The UK has major pipeline interconnection in the European market. So if* any gas was fracked in UK, it could be sold into Europe at European prices – that's just financial logic for gas producers.
* We know that UK fracking would be difficult & costly.
eciu.net/insights/2021/…
9.
So, that chart has to be interpreted carefully – in order to avoid the classic mistake of focusing on one fact without understanding the context and so reaching an erroneous conclusion.
So, that chart has to be interpreted carefully – in order to avoid the classic mistake of focusing on one fact without understanding the context and so reaching an erroneous conclusion.
• • •
Missing some Tweet in this thread? You can try to
force a refresh


