✞ inversecos🩸 Profile picture
Mar 9, 2022 13 tweets 5 min read Read on X
1\ How to detect what command line spawned a process with no EDR/AV? 👀 #DFIR

If you have a memory sample, this is how you can figure out what cmd spawned the processes by using volshell and memory forensics.

STEP BY STEP GUIDE BELOW

👇 👇 👇 👇 

#MemoryForensics
2\ Each process in Windows is represented by an "EPROCESS" structure.

These EPROCESS blocks are joined in a doubly linked list structure. The flink (forward link) tells you the next process running and blink (backwards link) tells you the previous process.
3\ When you see a list of processes on a live system, often times this is gathered by walking this doubly-linked structure of EPROCESS blocks.

Of course malware can unlink a process in this doubly linked list to hide from detection :P
4\ Now inside each of EPROCESS blocks is a pointer to a PEB (Process environment block). This is an object that stores information about a process like:

> What command started this process ;)
> The directory the process lives in
> handles, heaps etc

en.wikipedia.org/wiki/Process_E….
5\ Given this knowledge, this is how we'll figure out what spawned the process:

1. Examine the EPROCESS object for the process

2. Locate the PEB pointer

3. Locate “_RTL_USER_PROCESS_PARAMETERS” inside the PEB that stores the command line that the process was started with
6\ STEP 1: Enter volshell.

To enter into volshell type in this command into Volatility:

vol.py -f <filename> —profile=<profile> volshell
7\ STEP 2: Enter into the context of the process - in this instance I will use cmd.exe

Type in ps() to see the running processes and to get the:
> PID
> Offset

Type in cc(pid=X) to enter into the context of the process
8\ STEP 3: Examine the EPROCESS structure of the process

Type in dt(“_EPROCESS”, <offset>)

Scroll until you see the decimal address of the PEB and convert that into hex address :) I have it highlighted in white at the bottom.
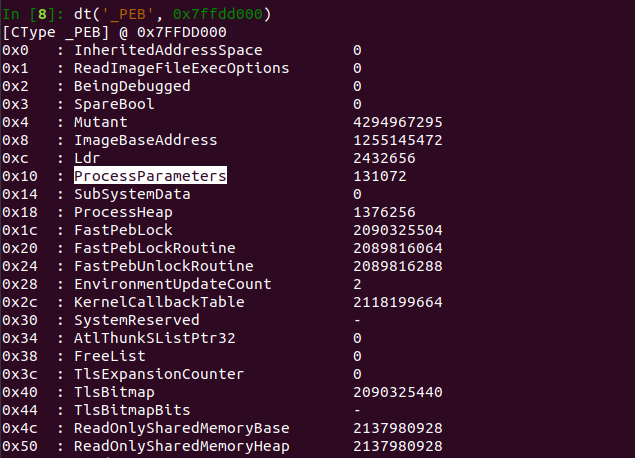
9\ STEP 4: Examine the PEB of the process

Type dt(“_PEB”, <PEB address>)

This address is what you converted into hex from the step above. This reveals the structures within the PEB.

Locate the “ProcessParameters” structure and convert the decimal address into HEX again.
10\ STEP 5: Fetch the command that spawned the process

With the converted ProcessParameters hex address, type:
dt(“_RTL_USER_PROCESS_PARAMETERS”, <hexaddress>)

Voila, this will then show you the command line that spawned the process :)
11\ The plugins pstree/pslist/psxview/psscan show you what processes were running/terminated.

You can use the technique I showed you above to see how those processes were spawned and the command lines that were used. :)
12\ This is a link to volatility <3 <3
github.com/volatilityfoun…
13\ I never know if you guys prefer these as tweets or as a blog..

• • •

Missing some Tweet in this thread? You can try to force a refresh
 

Keep Current with ✞ inversecos🩸

✞ inversecos🩸 Profile picture

Stay in touch and get notified when new unrolls are available from this author!

Read all threads

This Thread may be Removed Anytime!

PDF

Twitter may remove this content at anytime! Save it as PDF for later use!

Try unrolling a thread yourself!

how to unroll video
  1. Follow @ThreadReaderApp to mention us!

  2. From a Twitter thread mention us with a keyword "unroll"
@threadreaderapp unroll

Practice here first or read more on our help page!

More from @inversecos

Feb 19
1\ My thoughts on the Chinese APT contractor leak 🇨🇳

Specifically, I want to talk about the leaked
- iOS Spyware
- Physical implantable devices
- Email surveillance system

Let's consider detection and how these would be installed.
2\ The iOS spyware requires no jailbreak.

This should not "scare" you at all.

The capabilities of the leaked Chinese APT contractor "iOS Spyware" are accessing:

- basic mobile phone data
- GPS location
- Contacts
- Photos / multimedia files
- Recording sounds

If this sounds familiar, it should. These are settings accessible...Accessible ANY application requesting these permissions on a phone :)

This means, the delivery for the "spyware" would likely (my guess) be in the form of an application that the user installs on their device and must approve these permissions. If you've ever done mobile forensics, this is almost one of the first things you would check.Image
3\ The implantable devices are very similar in concept to the Hak5 devices.

This is not a new attack vector and NOT novel.

However, this should serve as a push for businesses to consider their threat models and playbooks for this kind of event.

Specifically the vendor's devices are disguised as:
- A power strip
- A power adapter

The way they work (as per the document) is:
1. Cracks WiFi password, sets up socks proxy
3. Cracks routing device
4. Self destruction to clear all system data

From an ops standpoint this targets a weak point of most businesses as most orgs do not have the best logging set up for their peripheral devices. It's why a lot nation states target edge devices for initial access (EDR blindspot / logging blindspot and difficulty of analysis for blue teamers).

However, once they pivot onto a vulnerable device or onto the network... the work of the detection team stays the same, it may just be difficult (in the absence of logs) to piece together what occurred.Image
Image
Read 6 tweets
Oct 26, 2022
1\ #DFIR: Chrome Forensics - How to Recover CLEARED History

If a user just cleared their browser history, you can still recover everything they were just looking at from the session files:

%appdata%\Local\Google\Chrome\User Data\Default\Sessions

inversecos.com/2022/10/recove…
2\ In some instances (more on this) the session and tab files inside that folder show the webkit/chrome date for when the session was exited.

This allowed me to put together a full timeline of what this naughty boy was doing *BONK*
3\ Historically, evidence of cleared history was in the Favicons file, but this is INCONSISTENT. Specifically under the table named "icon_mapping".

%appdata%\Local\Google\Chrome\User Data\Default\Favicons
Read 7 tweets
Oct 13, 2022
1\ #DFIR: How to investigate insider threats

Sharing the forensic methodology I follow when I'm investigating insiders 😍

This is where an employee sells creds/changes configs/runs malware leading to full DA compromise and then say they didn't do it O_o

inversecos.com/2022/10/how-to…
2\ The questions that I use to guide the analysis and prioritisation of analysis are:

1. How was the device accessed around the suspected behaviour?

2. Where was the user/device when this occurred?

3. Was the insider active on their system?

4. What did the user do?
3\ To answer the first question, I look at SRUM, specifically the App Timeline Provider details.

I pull:
> Execution time of the malicious thingz
> Duration of execution
> User SID

Then, I cross correlate that user info with their corresponding ActivitiesCache.db. #DFIRISS3XY
Read 7 tweets
Aug 23, 2022
1\ #ThreatHunting: Detecting OAuth Token Theft in Azure / M365

This technique is STILL being abused by Chinese APT groups. This blog covers several methods of detecting this technique😈.

It's also a good reminder to always perform browser forensics ;)

inversecos.com/2022/08/how-to…
2\ METHOD 1: Look for the OAuth redirect consent link in browser history and/or proxy logs.

Take note of the following fields:
- client_id (malicious app id)
- redirect_uri (malicious domain)
- scope (API permissions requested)
3\ Review permissions requested in the scope field (I'll show you where else to find these permissions in the logs).

Take note of these:
- User.Read
- User.ReadWrite
- User.ReadWrite.All
- Mail.ReadWrite
- Calendars.ReadWrite
- Files.ReadWrite
- User.Export.All
Read 6 tweets
Aug 5, 2022
1\ #DFIR: How to detect Linux Timestomping

Analyse the entries in these two files:
> filesystem.db
> filesystem.db-wal

Most writeups focus on detecting the use of "touch". But you can timestomp without using "touch". 😈

Check out my blog below 👇
inversecos.com/2022/08/detect…
2\ The file "filesystem.db" (enabled by default) tracks:
> fileCreated time
> fileLastAccessed time

Look for discrepancies in the fileCreated time in this DB file vs the times that "stat" show on a file.

There's also a correlating WAL that contains uncommitted data :3
3\ As you can see, this has caught an instance of timestomping where you can observe the creation time is after the access time.

You can query the db using this command:
sqlite3 *filesystem.db .dump | grep <filename>
Read 5 tweets
Jul 21, 2022
1\ #ThreatHunting for APT abuse of Exchange

APT Exchange abuse has been a common theme with techniques ranging from:
> Compiled DLL OWA backdoors
> .req webshells
> EWS / Legacy auth abuse
> Log / File deletion

TL;DR below or check out the full blog 👇👇
inversecos.com/2022/07/huntin… Image
2\ EWS and other legacy auth is commonly abused by APT groups (when enabled).

Check MSExchange Management.evtx log for EWS abuse.

Look for cmdlets like (more cmdlets in blog)
> New-MailboxExportRequest
> Remove-MailboxExportRequest
> Search-Mailbox
> Set-Mailbox Image
3\ Hunt IIS logs in Exchange for:
> Exploitation of unpatched vuln
> Webshell/owa backdoors being used
> Exfil

I've noted across engagements this happens in chunks via several extensions 7Z, TAR, RAR, PST, OST, CAB, ZIP). APTs will use several diff file types on one engagement Image
Read 9 tweets

Did Thread Reader help you today?

Support us! We are indie developers!


This site is made by just two indie developers on a laptop doing marketing, support and development! Read more about the story.

Become a Premium Member ($3/month or $30/year) and get exclusive features!

Become Premium

Don't want to be a Premium member but still want to support us?

Make a small donation by buying us coffee ($5) or help with server cost ($10)

Donate via Paypal

Or Donate anonymously using crypto!

Ethereum

0xfe58350B80634f60Fa6Dc149a72b4DFbc17D341E copy

Bitcoin

3ATGMxNzCUFzxpMCHL5sWSt4DVtS8UqXpi copy

Thank you for your support!

Follow Us!

:(