Gavin Hales Profile picture
Mar 9, 2022 9 tweets 4 min read Read on X
I wasn't aware until yesterday that #policeworkforce data on police officers in E&W are now published with a detailed breakdown of their ethnicity (18+1 categories).

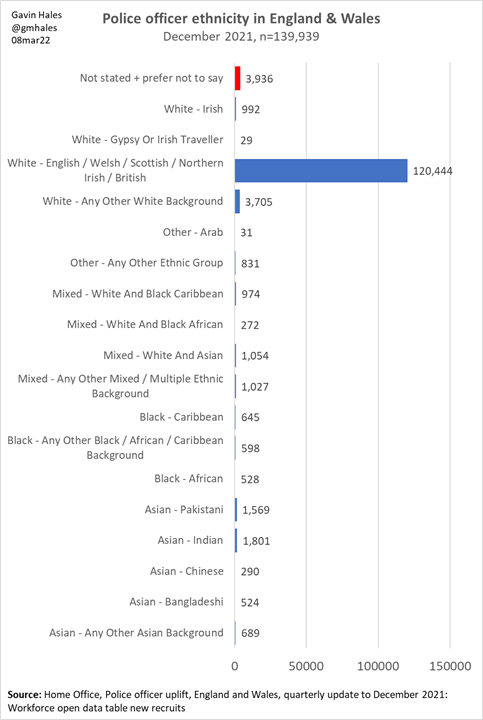
Here's the full breakdown as at Dec 2021, in numbers and percentages.

1/🧵
Here's Asian representation - this is the % of police officers in each force.

2/
Here's Black representation, again by force. Note the importance of police officers with mixed Black/White heritage - and especially Black Caribbean/White heritage - to overall Black representation.

3/
A reminder that 47% of people in E&W with Black or Black/White mixed heritage live in London

4/
And here's a link to a recent thread in which I examine the contribution of people with mixed heritage to Black and Asian representation in the police service.

5/
And here's White representation. I've included the data on 'not stated' and 'prefer not to say' here as I strongly suspect the vast majority will relate to White officers (e.g. see D&C and Dyfed-Powys).

6/
Source for the detailed police officer ethnicity data (not published for police staff, PCSOs etc): Home Office Police officer uplift, England & Wales, quarterly update to Dec 2021: Workforce open data table new recruits assets.publishing.service.gov.uk/government/upl… via gov.uk/government/sta…

7/
Finally, here's a link to my thread from yesterday looking at female representation

#policeworkforce

8/
Adding the breakdown of police officer ethnicity published by the Metropolitan Police, because the categories are slightly different. The use of Black British (and relatively few Black Other) seems important. Note the broken horizontal x-axis.

9/

• • •

Missing some Tweet in this thread? You can try to force a refresh
 

Keep Current with Gavin Hales

Gavin Hales Profile picture

Stay in touch and get notified when new unrolls are available from this author!

Read all threads

This Thread may be Removed Anytime!

PDF

Twitter may remove this content at anytime! Save it as PDF for later use!

Try unrolling a thread yourself!

how to unroll video
  1. Follow @ThreadReaderApp to mention us!

  2. From a Twitter thread mention us with a keyword "unroll"
@threadreaderapp unroll

Practice here first or read more on our help page!

More from @gmhales

Oct 10
I've been wondering recently how many racist police officers were racist when they joined, and whether part of the issue is logical fallacies arising from having a lot of contact with very narrow sections of society in places they may not otherwise be familiar with.
This links to the notion of 'blue-tinted spectacles', described to me some years ago by a serving officer
Does this analogy work? Imagine you run a car repair garage and for whatever reason most of your customers drive BMWs, and they only bring them to you when they break down. Is there a risk you start thinking there's something wrong with BMWs in particular?
Read 9 tweets
Jul 25
Something I've been reflecting on recently: I worry that an emphasis on places (e.g. hotspot policing) over people (those causing the greatest harm) may be a driver of disproportionality and especially 'false positive' contact between policing and the public.
Linked to this, I worry that policing generally does not adequately clarify the *number of people they believe are causing the greatest harms* in particular locations.
Lots of possible examples, but take robbery: hypothetically, you might have 100 robberies in an area (a 'robbery hotspot') over a period of time, each with one suspect. You have named suspects for only 15, consisting of 10 people. For the other 85 only approx age, sex, ethnicity.
Read 12 tweets
May 27
On Sunday, the Guardian ran an article looking at what has happened to ethnic disparities in the UK 5yrs on from George Floyd. It includes this chart on Stop and Search (which relates to Eng+Wal). What it misses is the impact of switching from the 2011 to 2021 Censuses [cont'd] Image
Handily, the Home Office publishes an 'ethnic disparities time series dashboard' for stop and search. Here's Greater Manchester Police. Note how in the top R chart black/white disparity increases to a cliff edge after 2019/20. #stopsearch assets.publishing.service.gov.uk/media/66f44156…Image
It looks like racial disparity got worse for a decade before suddenly improving. Was that a police force growing increasingly racist, followed by George Floyd/BLM effect?
Read 8 tweets
Feb 11, 2024
I had a look at #schoolexclusions data the other day, and since then received a breakdown with sex and FSM eligibility as well as ethnicity - this time for all state schools (not just secondary) across 4 years.

In this thread I'll present various ways of looking at the data. 🧵
The main question I'll be examining is how rates of exclusion compare between white and black pupils. As a rule, Asian pupils are excluded less often.
In this first chart, we see that boys are permanently excluded more often than girls. Across both sexes black Caribbean children are exluded more often than white British, followed by black African and children of 'other' white backgrounds. Image
Read 17 tweets
Jan 8, 2024
A thread on the likely interaction of systemic/structural inequalities and institutional racism, looking at #knifecrime involving young people in London. 🧵
1) Police data on knife crime shows clear racial disproportionality in both victimisation and offending (which overlap), with violence concentrated in more deprived neighbourhoods; higher crime areas are typically allocated more police resources.
2) In discussing knife crime, it is common for people to highlight its presence in 'black communities', and to responsibilise 'black communities' or 'the community' to find solutions. (No-one ever talks about white Londoners in those terms.)
Read 28 tweets
Apr 27, 2023
The Home Office published their quarterly update of crime outcomes data today, and I've been taking my periodic look at rape charge rates.

Here, first, we see that the charge rate for rapes recorded in 2020/21 has now reached 4.0% and continues to rise. #crimestats

1/ 🧵 Image
I can provide this kind of analysis because I've been collating an archive of the quarterly updates over the last 2 yrs, something I'm not aware anyone else has done.

Here's a summary of the data.

2/ Image
We can look at charge rate progression in chart form, comparing where successive years have got to. The dashed lines and hollow markers indicate no refresh of the data published at that point.

3/ Image
Read 11 tweets

Did Thread Reader help you today?

Support us! We are indie developers!


This site is made by just two indie developers on a laptop doing marketing, support and development! Read more about the story.

Become a Premium Member ($3/month or $30/year) and get exclusive features!

Become Premium

Don't want to be a Premium member but still want to support us?

Make a small donation by buying us coffee ($5) or help with server cost ($10)

Donate via Paypal

Or Donate anonymously using crypto!

Ethereum

0xfe58350B80634f60Fa6Dc149a72b4DFbc17D341E copy

Bitcoin

3ATGMxNzCUFzxpMCHL5sWSt4DVtS8UqXpi copy

Thank you for your support!

Follow Us!

:(