Today’s #COVID19 data shows increases in infections across all four nations of the UK ⬇
ow.ly/b05t50IgX0v Graphic with the following text: Estimated number of people
#COVID19 infection rates remained high across all regions of England.

Increases were seen in

▪️the North West
▪️East Midlands
▪️West Midlands
▪️East of England
▪️and London

in the week ending 5 March 2022. Line chart with following title: The percentage of people te
Infection rates increased in England for those aged 25 years and over and decreased in those aged school Year 7 to 11, in the week ending 5 March 2022. Line chart with following title: The percentage of people te
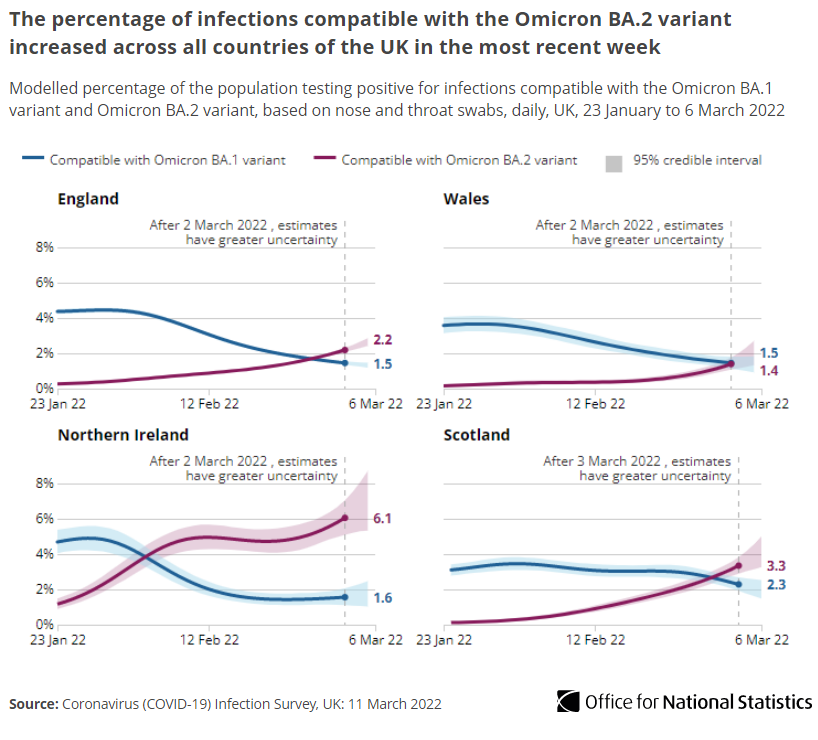
Up to 6 March 2022, Omicron BA.2 variant infections increased in England, Wales, Northern Ireland and Scotland.

In contrast Omicron BA.1 variant infections decreased in England, Wales and Scotland with an uncertain trend in Northern Ireland ow.ly/b05t50IgX0v
Our #COVID19 insights interactive tool shows the latest trends in infections, deaths and hospitalisations.

Data on COVID-19 from the ONS, Joint Biosecurity Centre and @UKHSA highlights the state of the pandemic across the UK ow.ly/b2S450IgXOC Graphic showing screengrab of coronavirus latest insights we
#COVID19 hospitalisations increased in England in the week ending 6 March 2022, with most regions and age groups seeing increases ow.ly/ws4v50IgXZ7 Line chart with following title: Hospital admissions involvi
Positive #COVID19 hospital admissions in children aged under 15 years (for 27 Feb 2022), were over one a half times the peak admission for these age groups from 17 Jan 2021 ow.ly/ws4v50IgXZ7 Line chart with following title: COVID-19-positive admission
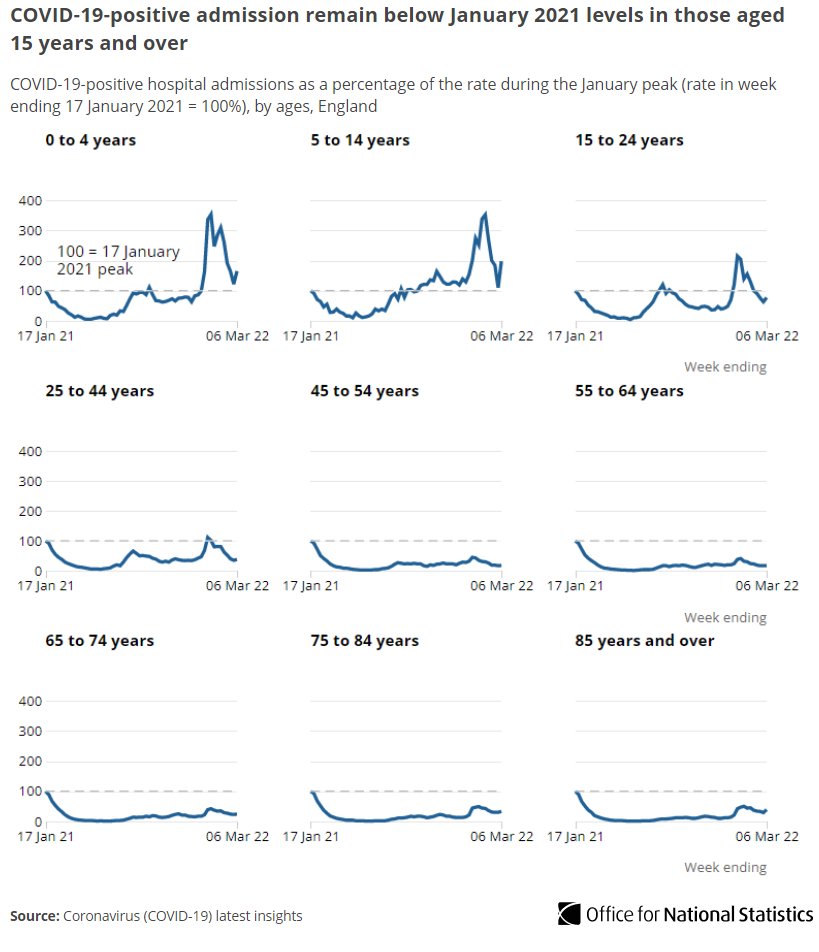
When infections were at the highest level in the second wave (week ending 9 Jan 2021), the hospital admission rate was over three times higher, and the death rate involving #COVID19 was almost eight times higher than in the most recent week ow.ly/b2S450IgXOC Line chart with following title: Despite high infection leve

• • •

Missing some Tweet in this thread? You can try to force a refresh
 

Keep Current with Office for National Statistics (ONS)

Office for National Statistics (ONS) Profile picture

Stay in touch and get notified when new unrolls are available from this author!

Read all threads

This Thread may be Removed Anytime!

PDF

Twitter may remove this content at anytime! Save it as PDF for later use!

Try unrolling a thread yourself!

how to unroll video
  1. Follow @ThreadReaderApp to mention us!

  2. From a Twitter thread mention us with a keyword "unroll"
@threadreaderapp unroll

Practice here first or read more on our help page!

More from @ONS

Mar 11
GDP grew 0.8% in January and is now 0.8% above its pre-pandemic peak.

Services grew 0.8% (1.3% above), manufacturing grew 0.8% (1.6% below) and construction grew 1.1% (1.4% above) ow.ly/mntG50IgJ9V GDP growth   January 2022 growth and change since February 2
Total underlying goods imports grew £4.7bn in January; EU imports grew £4.7bn and non-EU imports remained flat.

Total underlying goods exports fell £2.5bn in January; non-EU exports fell £3.0bn while EU increased by £0.6bn ow.ly/1Y5150IgJcs Chart title: Imports of goods from EU countries have increas
Commenting on today’s GDP figures for January, Darren Morgan said: (1/3)

⬇️ Commenting on GDP for January, ONS Director of Economic Stat
Read 5 tweets
Mar 9
When you think about your income, spending, savings, and any property you own, do you consider yourself richer or poorer than average? 💰

Use our new calculator which compares your financial situation with other households (data is from pre #COVID19) 🧮 ow.ly/bYZ650IeIJp How do your finances compar...
1 in 3 households spent more than their income before #COVID19 💳

Some households may be able to maintain higher spending by using financial buffers accumulated over their lifetime, but others may need to make cutbacks, or borrow, to make up the shortfall. 35% of British households w...
Smaller households were the most likely to be spending more than their income and those not retired lacked a sufficient financial buffer.

A financial buffer is made up of cash (money in current accounts), savings and other easy-to-access assets such as shares. Chart title: People living ...
Read 7 tweets
Mar 3
The system average price of gas increased by 17% in the week to 27 Feb 2022, according to @NationalGridUK data ⛽

This was the largest weekly growth since 19 Dec 2021 ow.ly/qQ7e50I8Rs5
Our Opinions and Lifestyle survey found 81% of adults said their cost of living increased over the last month (16 to 27 Feb 2022).

The most reported reasons continued to be:

🛒 rising food shop prices (92%)
🧾 rising energy bills (80%)
⛽ increases to the price of fuel (76%).
According to @Springboard_, overall retail footfall in the UK in the week to 26 Feb 2022 increased by 11% from the previous week, after a period of adverse weather conditions throughout the UK 🛍
Read 4 tweets
Mar 3
We’ve looked at substance use, symptoms of common mental disorder and personal well-being in adults who reported being a victim of crime in the last year.

This is based on findings from the Telephone-operated Crime Survey for England and Wales (TCSEW)⬇️

ow.ly/EzqK50I8QJY Promo graphic showing icon of statistical document with the
Approximately 1 in 15 (6.5%) adults aged 18 to 59 years and 1 in 7 (15.0%) adults aged 18 to 24 years had taken a drug in the previous year.
Cannabis was the most commonly taken drug in the last year (reported by 1 in 17 or 5.8% of adults aged 18 to 59 years).

This was followed by cocaine (reported by 1 in 48 or 2.1% of adults aged 18 to 59 years). Bar chart with following title: 18-to-24-year-olds reported
Read 5 tweets
Mar 3
An estimated 1.5 million people living in private households in the UK (2.4% of the population) were experiencing self-reported long COVID as of 31 January 2022 ow.ly/MVJi50I8Qt0 Bar chart with following title: 1.5 million people were expe
Of people with self-reported long COVID in the 4 weeks to 31 January 2022

▪️22% first had/suspected COVID-19 less than 12 weeks ago
▪️71% first had/suspected COVID-19 at least 12 weeks ago
▪️45% first had/suspected COVID-19 at least one year previously.
Prevalence of self-reported long COVID was greatest in those who were

▪️aged 35 to 49
▪️female
▪️living in more deprived areas
▪️working in teaching and education or social care or health care
▪️and those with another activity-limiting health condition or disability.
Read 4 tweets
Mar 2
Our latest #COVID19 data show those who reported having travelled abroad in the last 28 days continued to be more likely to test positive than those who had not in the fortnight up to 12 February 2022 ow.ly/O92z50I7NXB
Latest #COVID19 data also show those working in the education sector were more likely to test positive than other working adults (in the fortnight up to 12 February 2022).

This is likely because of the high infection levels in school children.
In those who tested positive for #COVID19, the percentage reporting losing their sense of taste or smell continued to decrease between December 2021 and January 2022. Bar chart with the following title: The percentage of people
Read 4 tweets

Did Thread Reader help you today?

Support us! We are indie developers!


This site is made by just two indie developers on a laptop doing marketing, support and development! Read more about the story.

Become a Premium Member ($3/month or $30/year) and get exclusive features!

Become Premium

Don't want to be a Premium member but still want to support us?

Make a small donation by buying us coffee ($5) or help with server cost ($10)

Donate via Paypal

Or Donate anonymously using crypto!

Ethereum

0xfe58350B80634f60Fa6Dc149a72b4DFbc17D341E copy

Bitcoin

3ATGMxNzCUFzxpMCHL5sWSt4DVtS8UqXpi copy

Thank you for your support!

Follow Us on Twitter!

:(