Coffee & Candlesticks - Edition 4
Please check out this week’s edition of our market insights and analysis using Hyblock.
(1/8)
Please check out this week’s edition of our market insights and analysis using Hyblock.
(1/8)
2/ Probability Histogram:
On the weekly open, there was extreme behavior from retails and whales. Whale long% (top trader positions) was extremely low, while retail long% (Global longs) was extremely high.
On the weekly open, there was extreme behavior from retails and whales. Whale long% (top trader positions) was extremely low, while retail long% (Global longs) was extremely high.

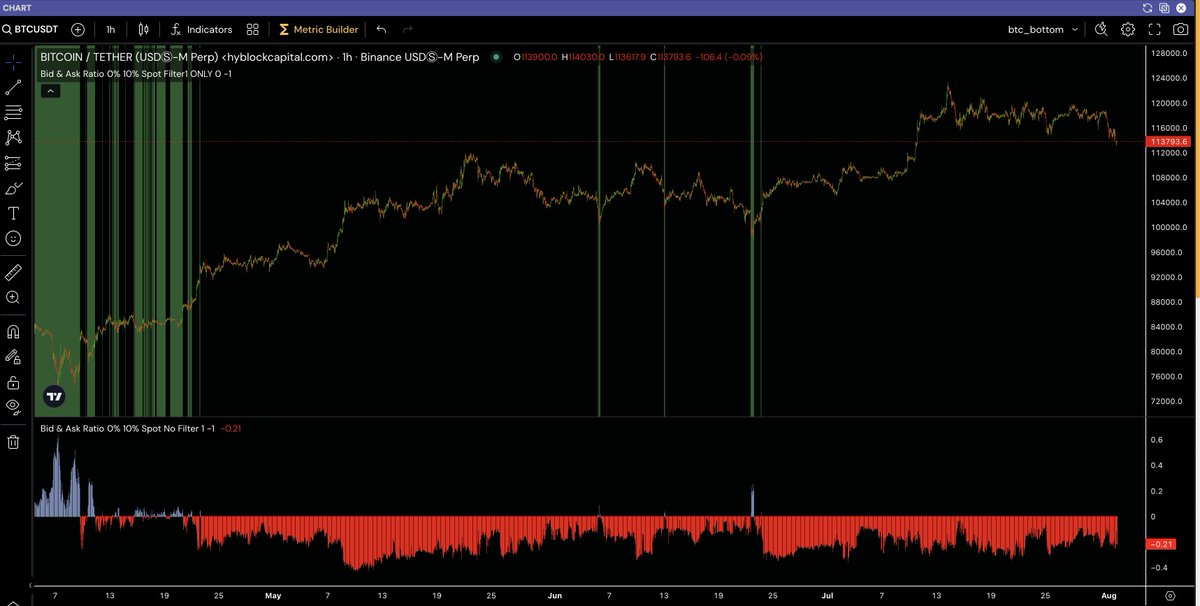
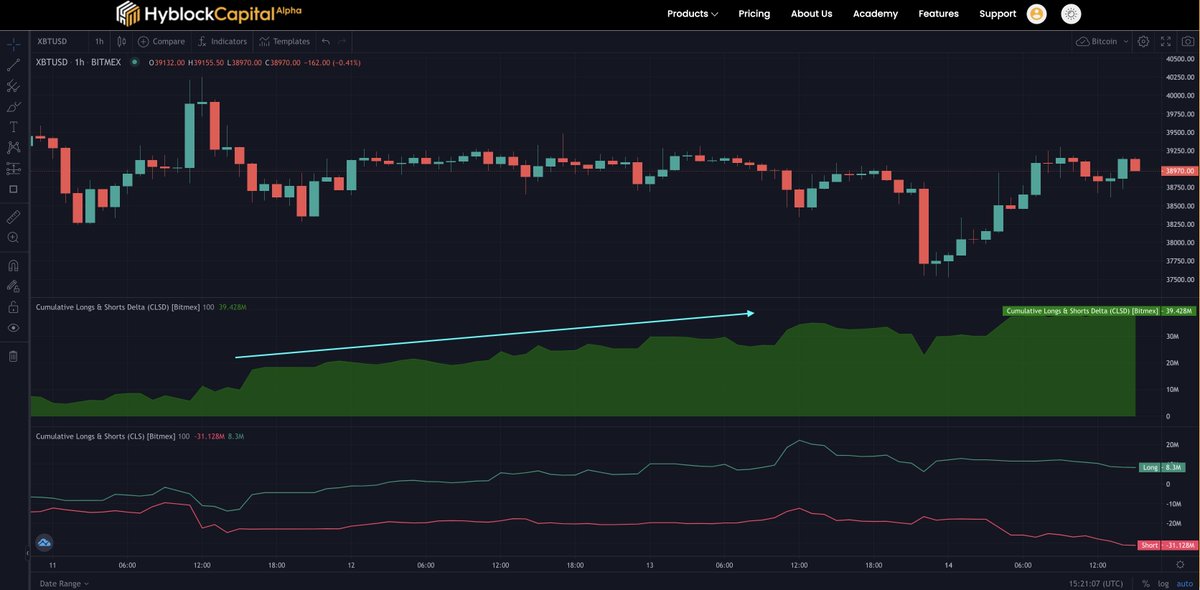
3/ Cumulative Long & Short Delta:
Over the last few days, Cumulative long & short delta (CLSD) has increased due to an increase in net longs and a decrease in net shorts.
Over the last few days, Cumulative long & short delta (CLSD) has increased due to an increase in net longs and a decrease in net shorts.
4/ Open Interest Delta
Support / resistance zones are currently around 40.2k-40.8k, 39.4k-39.65k, and 38.75k based on where a larger number of contracts opened across all major exchanges (OI Delta [aggregated]).
Support / resistance zones are currently around 40.2k-40.8k, 39.4k-39.65k, and 38.75k based on where a larger number of contracts opened across all major exchanges (OI Delta [aggregated]).

5/ Top Trader leverage
As price has decreased from the high on March 9th, top traders have increased their short leverage and decreased their long leverage. From the daily open today, long leverage has started to increase.
As price has decreased from the high on March 9th, top traders have increased their short leverage and decreased their long leverage. From the daily open today, long leverage has started to increase.

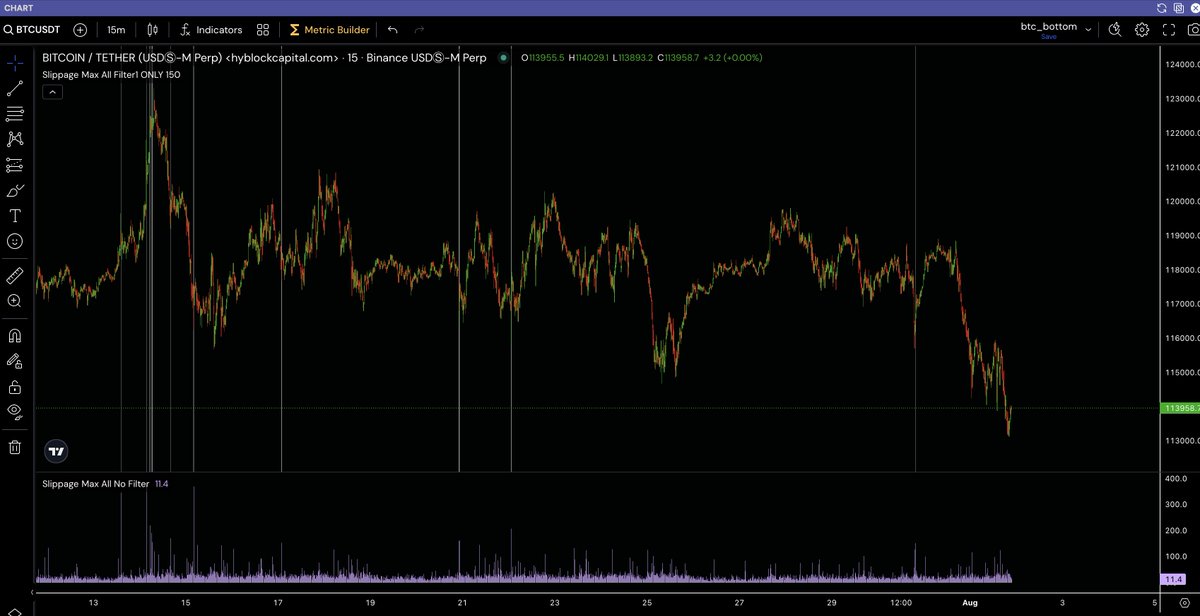
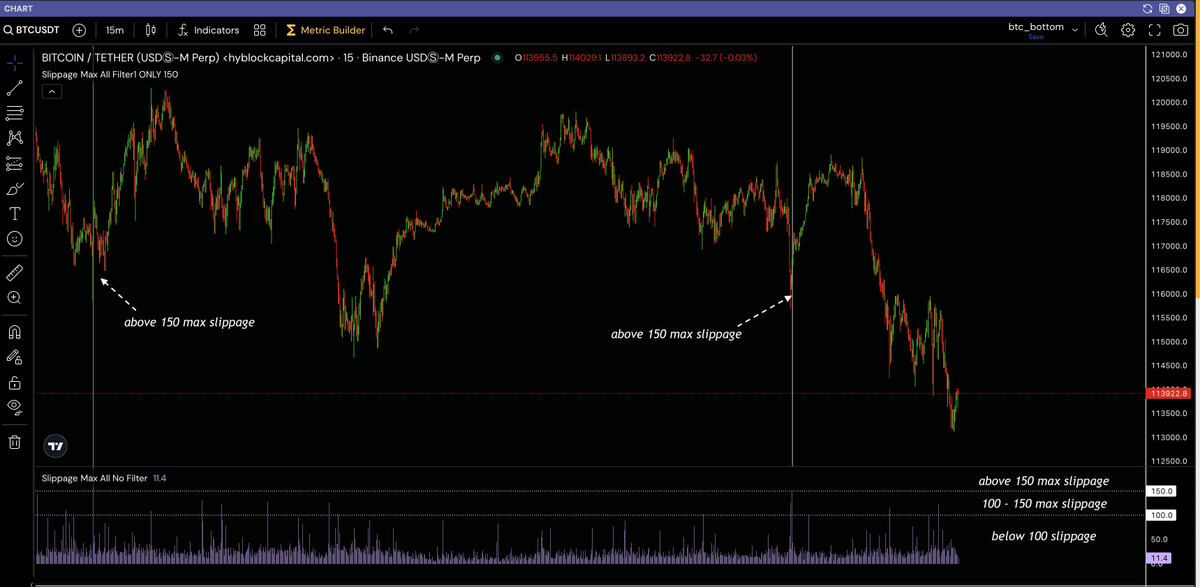
6/ Market & Limit Order Average Size
During the ranging period of March 12th - 13th, we see larger aggressive (market) sell orders coupled with larger passive (limit) buy orders → signs of possible accumulation.
During the ranging period of March 12th - 13th, we see larger aggressive (market) sell orders coupled with larger passive (limit) buy orders → signs of possible accumulation.

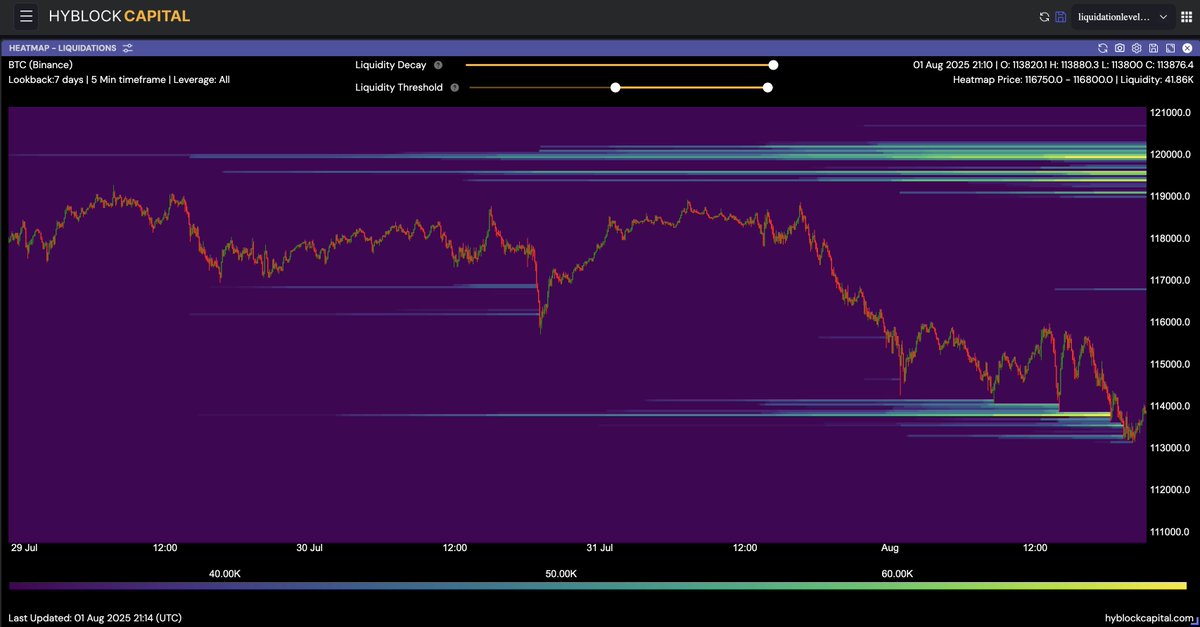
7/ Liquidations & OI Profile:
Large concentration of short liquidation levels between 40k - 41k, and concentrations of long liquidations between 37-38k. Open Interest Profile gaps exist in those ranges as well adding a layer of confluence.
Large concentration of short liquidation levels between 40k - 41k, and concentrations of long liquidations between 37-38k. Open Interest Profile gaps exist in those ranges as well adding a layer of confluence.


8/ Thank you for reading, stay tuned for video covering this soon.
See link for last week's video:
All above indicators can be found on: hyblockcapital.com
See link for last week's video:
All above indicators can be found on: hyblockcapital.com
• • •
Missing some Tweet in this thread? You can try to
force a refresh