1/ Hyblock products are designed to complement each other.
Let's take a look at how some of these tools are used in the lifecycle of a trader, beginning with the coin screener, which provides a "bird's eye view" of the market 🧵
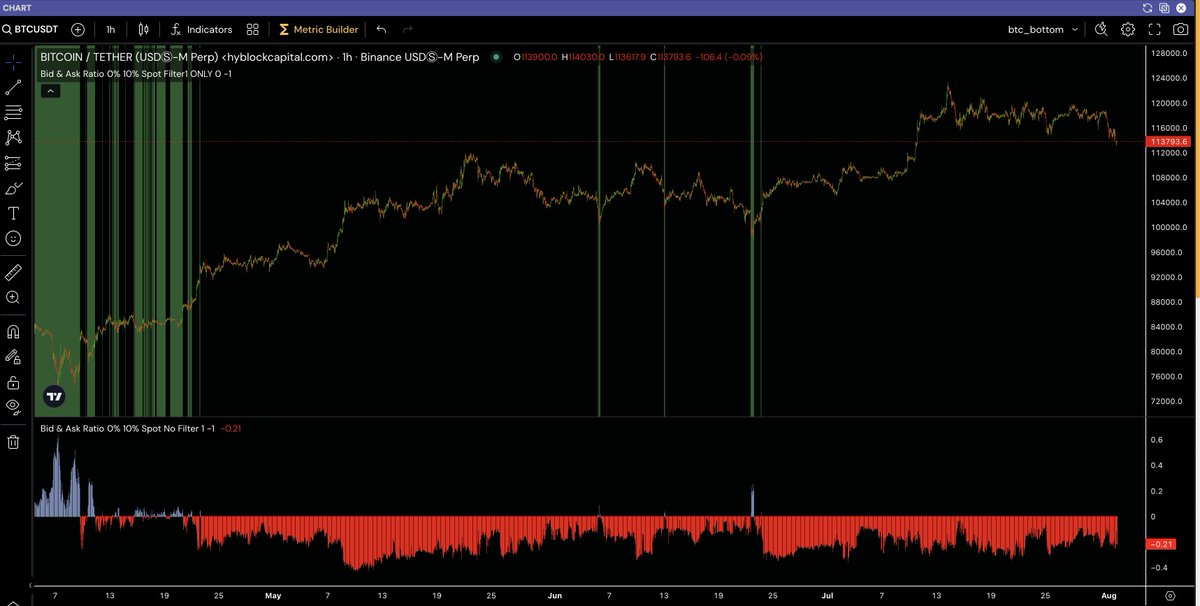
We start by scanning a powerful metric: Top Traders Positions (Long%)
This can often be a proxy for whale long%
Feb 1, 2023 • 5 tweets • 2 min read
Want a bird's-eye view of open interest across the market?
You can access that via the Coin Screener product.
However, BTC and ETH OI overshadow the screener, as they are significantly higher than the rest of the market.
That's why we created 'Relative to Itself' mode.
'Relative to Itself' helps answer the question, "How does the current value compare to all past values for *this* coin?"
whereas 'Relative to Market' helps answer the question, "How does the current value compare to the current values of *all other* coins?"
Jan 9, 2023 • 7 tweets • 4 min read
1/ All eyes have been on $LDO recently 👀
So let's dive in and take a look at examples on what happened 🧵 
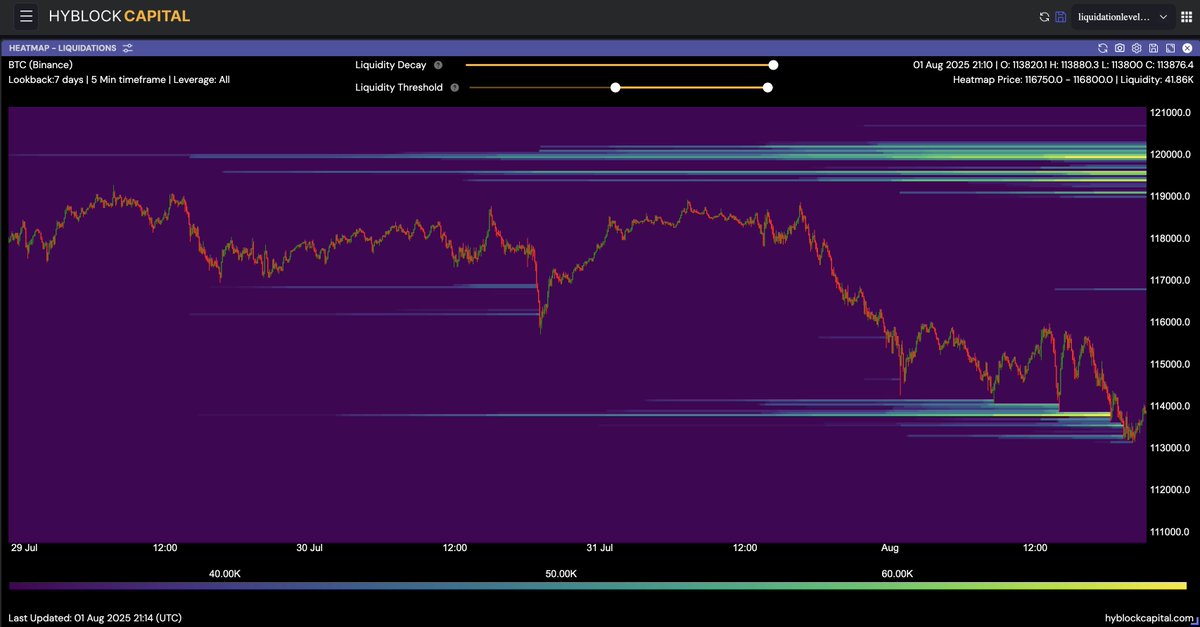
2/ Price shoots up and takes the entire short liq cluster (1st arrow)
But more importantly, new large short liq clusters form right away (2nd and 3rd arrow)
Finally, only when shorts stop chasing and a large short liq cluster is not formed above (4th arrow), price consolidates
Jan 5, 2023 • 7 tweets • 3 min read
1/ We track liquidations by size of trade.
This enables users to segment total liquidations based on liquidation size.
Here are interesting ways to analyze liquidations filtered by size buckets 🧵 2/ Here we look at liquidations segmented into 5 buckets:
0-100, 100-1k, 1k-10k, 10k-100k, and 100k-1m
As price spikes, we see two spikes in liquidations across all buckets.
The second spike shows divergence.
Jul 18, 2022 • 7 tweets • 2 min read
1/ Current retail (accounts) long%:
Binance: 38%
Okx: 48%
Bybit: 46%
🧵 2/ Shouldn't longs always equal shorts?
Well yes, in terms of overall positions (size), longs = shorts (in other words, OI).
But global long *accounts* looks at accounts, not positions.
Jul 10, 2022 • 8 tweets • 4 min read
1/ Weekends and ranging price often lead to stop hunts.
There have likely 5 stop loss hunts over the last 2 days.
We can track these by tracking slippage across major exchanges -- Binance, Bitfinex, Bybit and FTX.
Let's dive into each #BTC stop hunt 🧵 2/ Zooming in to the previous image, brings us to our first example.
Below the local low is likely where stop losses (SLs) lie. The first price drop does not lead to a spike in slippage, but the second price drop breaks the local low and spike in slippage => stop hunt #1
Jul 7, 2022 • 4 tweets • 2 min read
1/ Retail long% (blue) decreased from 52.65% to 45.37% in the last 24hours.
This means, 45.37% of accounts on Binance are long and is ranks less than 1st percentile in the last 3 months (an outlier). 2/ Top Trader Positions (proxy for whales) is 53.18% long, which in the last 3 months is not too unusual (64th percentile).
Jun 18, 2022 • 8 tweets • 3 min read
1/ 'Exit liquidity' is a common term being thrown around a lot these days.
You know what goes hand in hand with exit liquidity? Slippage.
Users can now track slippage either for an individual exchange or aggregated across multiple exchanges.
Let's dive into an example... 2/ Price sets the same low 4 times .. which means there is a good chance lots of stops below .. perfect for a stop hunt.
When price finally breaks this level, we see stops being triggered and probably a perfect stop loss hunt.
How do we know? Slippage.
Jun 16, 2022 • 7 tweets • 3 min read
Continuing where we left off yesterday, let's breakdown the last 7 days using okx sentiment:
1) Global Longs & Shorts Accounts [Okx] 2) Margin Lending Ratio [Okx]
5 part breakdown below.
Part 1 -- the Slow Decline
What we see here is retail trying to catch the bottom.
Retail long% (green) increases as price falls AND margin lending ratio increases (yellow) implying trapped leverage traders -> creating more fuel for the move down.
Jun 15, 2022 • 5 tweets • 2 min read
1/ New indicator added to Hyblock: Spot Margin Lending Ratio [Okx]
It shows how much USDT is borrowed versus how much BTC is borrowed (quoted in USDT) when trading BTC/USDT margin.
Very weird activity recently as the ratio has been rapidly increasing
Let's dive in ...🧵 2/
If the ratio is increasing, it implies that more USDT is being borrowed (usually used to increase exposure to BTC) -> and therefore bullish market sentiment
*but* bullish market sentiment, does not always mean bullish price action. Often, it is the opposite.
May 2, 2022 • 10 tweets • 4 min read
Coffee & Candlesticks - Edition 11
This week’s edition of market insights and analysis using Hyblock. Enjoy!
April was a red month with #BTC seeing an 18% decrease in price.
Since 2015, May has given positive returns month -- 5 out 7 times. It has also been a volatile month: largest price decrease last year (-33%) and 60%+ price increase in 2019 and 2017.
Apr 11, 2022 • 8 tweets • 3 min read
Coffee & Candlesticks - Edition 8
Please check out this week’s edition of our market insights and analysis using Hyblock.
(1/8)
2/ Liquidation Levels:
As price has dropped, new short term liquidation levels have formed above price. But there is also a large cluster of older liquidation levels below price.
Mar 28, 2022 • 9 tweets • 3 min read
Coffee & Candlesticks - Edition 6
Please check out this week’s edition of our market insights and analysis using Hyblock.
(1/9)
2/ Liquidations:
Even though yesterday was not an abnormally large pump, there were high amounts of liquidations across all exchanges.
Largest amount of liquidations since January.
Mar 21, 2022 • 8 tweets • 4 min read
Coffee & Candlesticks - Edition 5
Please check out this week’s edition of our market insights and analysis using Hyblock.
(1/8)
2/ Probability Histogram:
At the weekly open, for the 2nd week in a row, there was extreme behavior from whales. But this time, Whale long% (top trader positions) was extremely high. Since the weekly open, it has shifted to normal levels with price decreasing.
Mar 14, 2022 • 8 tweets • 3 min read
Coffee & Candlesticks - Edition 4
Please check out this week’s edition of our market insights and analysis using Hyblock.
(1/8)
2/ Probability Histogram:
On the weekly open, there was extreme behavior from retails and whales. Whale long% (top trader positions) was extremely low, while retail long% (Global longs) was extremely high.
Mar 7, 2022 • 7 tweets • 3 min read
Coffee & Candlesticks - Edition 3
Please check out this week’s edition of our market insights and analysis using Hyblock.
(1/7)
2/ Cumulative Volume Delta:
Since March 2nd we have seen opposite directional movement from whale cvd (blue) to retail cvd (orange).