📋National case overview
23rd March 2022 #COVID19Aus
📈AUS - Daily case rate (7-day average) by state
📈AUS - Daily hospitalised rate by state
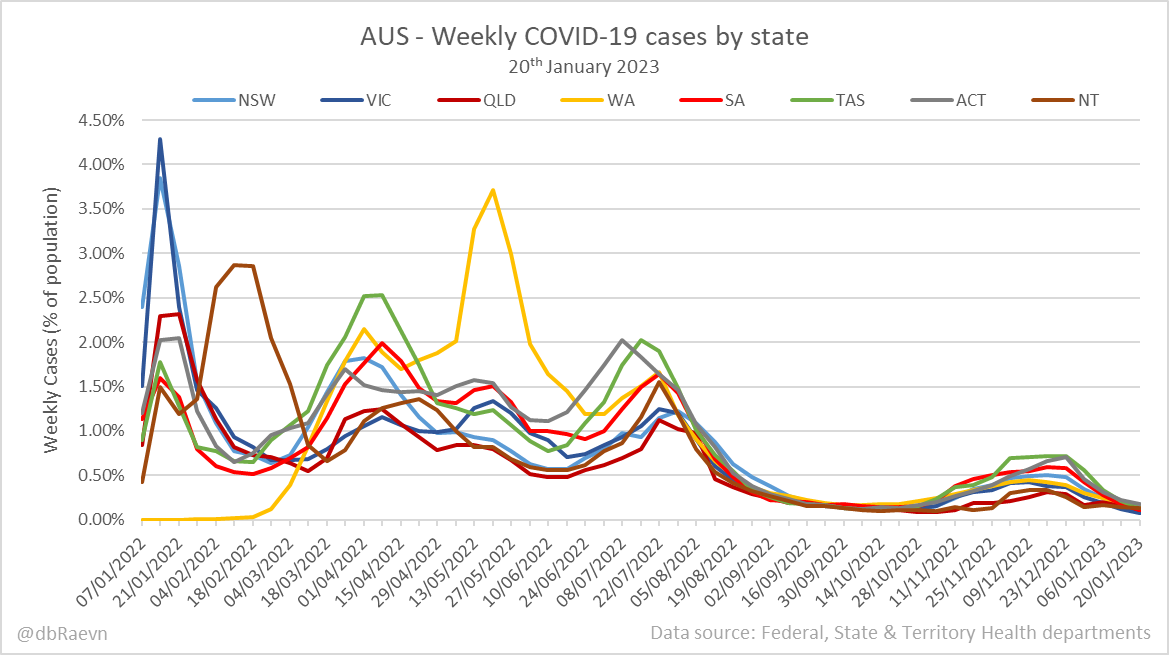
📊AUS - Cases as % of population
📊AUS - Deaths
📈Cases, Hospitalised, ICU by state
The following graphs show hospitalisations & ICU at 10% scale of cases. Most graphs except VIC and NSW use "as reported" numbers, which include no historical adjustment.
📈NSW, VIC, QLD, WA
📈SA, TAS, ACT, NT
📈AUS
• • •
Missing some Tweet in this thread? You can try to
force a refresh
📋National weekly COVID-19 overview
(Federal Department of Health and aged care)
17th January 2023 #COVID19Aus
This data is based on a different period (Wed-Tues) than what is reported by states today. The regular weekly report based on state data will also be produced today.
These charts are based on when deaths occurred rather than when they were reported. As a result, recent weeks are incomplete and provisional.
Previous weeks will be updated as newly reported deaths are backdated.
🧵QLD - Public Health Directions & Lockdowns #COVID19qld
Charting the lockdowns in QLD and the key public health directions related to movement, gatherings, mask wearing and businesses.
A small number of business types could not operate outside of the business closure period. But most were open with restrictions on capacity etc.
Restriction levels were constantly changing; mostly relating to gathering sizes at home and outside, and density/business limitations.
There were many more Directions than indicated - Directions for Hospitals, Aged Care, Borders, Quarantine etc. are not included. A total of 113 Directions are included in the chart covering restrictions relating to lockdowns, movement, gatherings, mask wearing and business.